Minutes of the Federal Open Market Committee, July 25-26, 2023: “Various participants commented on risks that could affect some banks, including unrealized losses on assets resulting from rising interest rates, significant reliance on uninsured deposits, and increased funding costs.”

Categories2023q3 Issue-3, Gamestop.

Source: https://www.federalreserve.gov/monetarypolicy/fomcminutes20230726.htm

Developments in Financial Markets and Open Market Operations:

The manager turned first to a review of developments in financial markets over the intermeeting period. Market participants interpreted data releases as generally demonstrating economic resilience and a further easing of inflation pressures. The market-implied peak for the federal funds rate rose in response to data pointing to a robust economy but retraced part of that move after the June consumer price index (CPI) release was interpreted by market participants as softer than anticipated. Even as market prices shifted to indicate a slightly more restrictive expected policy path, broader financial conditions eased a bit, reflecting in large part gains in equity prices and tighter credit spreads. Notably, share prices for bank equity also appreciated over the intermeeting period as concerns about the banking sector continued to dissipate. Spot and forward measures of inflation compensation based on Treasury Inflation-Protected Securities were little changed over the intermeeting period at levels broadly consistent with the Committee’s 2 percent longer-run goal, and longer-term survey- and market-based measures continued to point to inflation expectations being firmly anchored. Market-implied peak policy rates in most advanced foreign economies (AFEs) rose further this period, and the dollar depreciated modestly.

Respondents to the Open Market Desk’s Survey of Primary Dealers and Survey of Market Participants in July continued to place significant probability of a recession occurring by the end of 2024. However, the timing of a recession expected by survey respondents was again pushed later, and the probability of avoiding a recession through 2024 grew noticeably. Survey respondents anticipated that both headline and core personal consumption expenditures (PCE) inflation will decline to 2 percent by the end of 2025.

There was a strong anticipation, evident in both market-based measures and responses to the Desk’s surveys, that the Committee would raise the target range 25 basis points at the July FOMC meeting. Most survey respondents had a modal expectation that a July rate hike would be the last of this tightening cycle, although most respondents also perceived that additional monetary policy tightening after the July FOMC meeting was possible. As inferred from their responses, survey respondents expected real rates to increase through the first half of 2024 and to remain above their expectations for the long-run neutral levels for a few years.

The manager then turned to money market developments and policy implementation. The overnight reverse repurchase agreement (ON RRP) facility continued to work as intended over the intermeeting period and had been instrumental in providing an effective floor under the federal funds rate and supporting other money market rates; those rates remained stable over the period. Following the suspension of the debt ceiling in early June, the Treasury Department issued securities, notably Treasury bills, to replenish the Treasury General Account (TGA). The resulting greater availability of Treasury bills, which were priced at rates slightly above the current and expected ON RRP rates, induced a net decline in ON RRP balances for the period. A further decline in ON RRP balances was deemed probable amid sustained projected Treasury bill issuance, further reductions in the size of the Federal Reserve’s balance sheet in accordance with the previously announced Plans for Reducing the Size of the Federal Reserve’s Balance Sheet, and a possible further reduction in policy uncertainty that could incentivize money funds to extend the duration of their portfolios. In the July Desk Survey of Primary Dealers, respondents expected lower ON RRP balances and higher bank reserves by the end of the year, compared with the June survey.

By unanimous vote, the Committee ratified the Desk’s domestic transactions over the intermeeting period. There were no intervention operations in foreign currencies for the System’s account during the intermeeting period.

Staff Review of the Economic Situation:

The information available at the time of the July 25–26 meeting suggested that real gross domestic product (GDP) rose at a moderate pace over the first half of the year. The labor market remained very tight, though the imbalance between demand and supply in the labor market was gradually diminishing. Consumer price inflation—as measured by the 12-month percent change in the price index for PCE—remained elevated in May, and available information suggested that inflation declined but remained elevated in June.

In the second quarter, total nonfarm payroll employment posted its slowest average monthly increase since the recovery began in mid-2020, though payroll gains remained robust compared with those seen before the pandemic. Similarly, the private-sector job openings rate, as measured by the Job Openings and Labor Turnover Survey, fell in May to its lowest level since March 2021 but remained well above pre-pandemic levels. The unemployment rate edged down to 3.6 percent in June, while the labor force participation rate and the employment-to-population ratio were both unchanged. The unemployment rates for African Americans and Hispanics, however, both rose and were well above the national average. Average hourly earnings rose 4.4 percent over the 12 months ending in June, compared with a year­-earlier increase of 5.4 percent.

Consumer price inflation continued to show signs of easing but remained elevated. Total PCE price inflation was 3.8 percent over the 12 months ending in May, and core PCE price inflation, which excludes changes in energy prices and many consumer food prices, was 4.6 percent over the same period. The trimmed mean measure of 12-month PCE price inflation constructed by the Federal Reserve Bank of Dallas was 4.6 percent in May. In June, the 12‑month change in the CPI was 3.0 percent, while core CPI inflation was 4.8 percent over the same period. Measures of short-term inflation expectations had moved down alongside actual inflation but remained above pre-pandemic levels. In contrast, measures of medium- to longer-term inflation expectations were in the range seen in the decade before the pandemic.

Available indicators suggested that real GDP rose in the second quarter at a pace similar to the one posted in the first quarter. However, private domestic final purchases—which includes PCE, residential investment, and business fixed investment and which often provides a better signal of underlying economic momentum than does GDP—appeared to have decelerated in the second quarter. Manufacturing output rose in the second quarter, supported by a robust increase in motor vehicle production.

After falling sharply in April, real exports of goods picked up in May, led by higher exports of industrial supplies and automotive products. Real goods imports fell, as lower imports of consumer goods and industrial supplies more than offset higher imports of capital goods. The nominal U.S. international trade deficit narrowed, as a sharp decline in nominal imports of goods and services outpaced a decline in exports. The available data suggested that net exports subtracted from U.S. GDP growth in the second quarter.

Indicators of economic activity, such as purchasing managers indexes (PMIs), pointed to a step-down in the pace of foreign growth in the second quarter, reflecting fading of the impetus from China’s reopening, continued anemic growth in Europe, some weakening of activity in Canada and Mexico, as well as weak external demand and the slump in the high-tech industry weighing on many Asian economies. Incoming data also indicated that global manufacturing activity remained weak during the intermeeting period.

Foreign headline inflation continued to fall, reflecting, in part, the pass-through of previous declines in commodity prices to retail energy and food prices. Core inflation edged down in many countries but generally remained high. In this context, and amid tight labor market conditions, many AFE central banks raised policy rates and underscored the need to raise rates further, or hold them at sufficiently restrictive levels, to bring inflation in their countries back to their targets. In contrast, central banks of emerging market economies largely remained on hold, and some indicated that a rate cut is possible at their next meeting.

Staff Review of the Financial Situation

Over the intermeeting period, market participants interpreted domestic economic data releases as indicating continued resilience of economic activity and some easing of inflationary pressures, and they viewed monetary policy communications as pointing to somewhat more restrictive policy than expected. The market-implied path for the federal funds rate rose modestly, and nominal Treasury yields increased somewhat at shorter maturities. Meanwhile, broad equity prices increased, and spreads on investment- and speculative-grade corporate bonds narrowed moderately. Financing conditions continued to be generally restrictive, and borrowing costs remained elevated.

Over the intermeeting period, the market-implied path for the federal funds rate rose modestly, while the timing of the path’s slightly higher peak moved a little later, to just after the November meeting. Beyond this year, the policy rate path implied by overnight index swap (OIS) quotes ended the period modestly higher. Yields on Treasury securities increased modestly at shorter maturities but only a bit at longer maturities. Measures of inflation compensation rose only slightly for near-term and longer maturities. Measures of uncertainty about the path of the policy rate derived from interest rate options remained very elevated by historical standards.

Broad stock price indexes increased and spreads on investment- and speculative-grade corporate bonds narrowed moderately over the intermeeting period. The VIX—the one-month option-implied volatility on the S&P 500—edged down and ended the period near the 25th percentile of its historical distribution. Bank equity prices increased and outperformed the S&P 500 modestly. Stock prices for the largest banks fully recovered from their declines in the immediate wake of the failure of Silicon Valley Bank, while those for regional banks remained below the levels seen in early March.

Short-term interest rates in the AFEs increased modestly, on net, over the intermeeting period as foreign central banks continued to raise policy rates and signal the potential for further tightening. Increases in yields were tempered, however, by downside surprises to both inflation and PMIs from some economies. Risk sentiment in foreign markets improved somewhat, with most foreign equity indexes increasing and foreign corporate and emerging market sovereign bond spreads narrowing. The staff’s trade-weighted broad dollar index declined moderately, with the largest moves following releases of weaker-than-expected U.S. labor market data and lower-than-expected U.S. inflation data.

Conditions in domestic short-term funding markets remained generally stable over the intermeeting period. Spreads in unsecured markets narrowed modestly amid slight increases in OIS rates. Following the suspension of the debt limit, the Treasury Department partly replenished the TGA via a large net increase in bill issuance. Auctions of Treasury bills were met with robust demand, as shorter-term bill yields increased relative to other money market rates. Money market funds increased their holdings of Treasury bills and reduced their investments with the ON RRP facility. ON RRP take-up declined notably—about $390 billion—over the intermeeting period, reflecting more attractive rates on some alternatives to investing in the ON RRP facility. Despite reduced ON RRP take-up, money funds maintained relatively high asset allocations in overnight repurchase agreement investments amid still-elevated uncertainty about the future path of policy.

In domestic credit markets, borrowing costs for businesses, households, and municipalities were little changed over the intermeeting period and remained elevated by historical standards. Yields on agency commercial mortgage-backed securities (CMBS) were little changed.

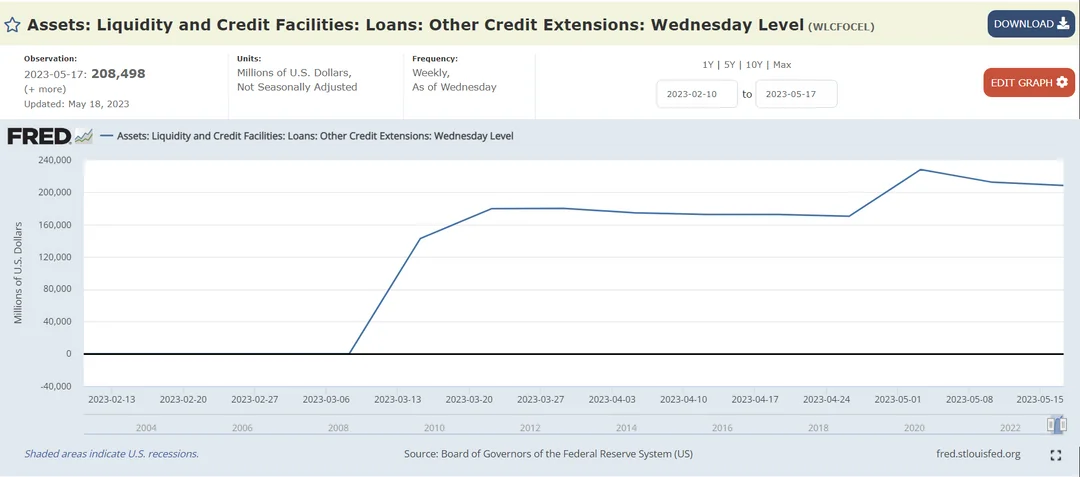
The banking sector’s ability to fund loans to businesses and consumers was generally stable during the intermeeting period. Core deposit volumes at both large and other domestic banks held steady at the levels that they reached in early May, after having declined sharply in March and April amid the banking-sector turmoil. Banks continued to attract inflows of large time deposits, reflecting higher interest rates offered on new certificates of deposit. Meanwhile, wholesale borrowing—which primarily consists of advances from Federal Home Loan Banks, loans from the Bank Term Funding Program, and other credit extended by the Federal Reserve—had fallen since May by domestic banks of all sizes, partially reversing the surge at the onset of the bank turmoil in March.

Credit availability for businesses appeared to tighten somewhat in recent months. Credit from capital markets was somewhat subdued but overall remained accessible for larger corporations. Issuance of leveraged loans remained limited, reflecting low levels of leveraged buyout and merger and acquisition activity as well as weak investor demand. In the municipal bond market, gross issuance was solid in June, as both refundings and new capital issuance picked up from a somewhat subdued May. Commercial and industrial (C&I) loan balances contracted modestly in the second quarter, and commercial real estate (CRE) loan growth on banks’ books continued to moderate.

In the July Senior Loan Officer Opinion Survey on Bank Lending Practices (SLOOS), banks reported having tightened standards and terms on C&I loans to firms of all sizes in the second quarter. The most cited reason for tightening C&I standards and terms continued to be concerns about the economic outlook. Banks also reported expecting to tighten C&I standards further over the remainder of the year.

The July SLOOS also indicated that standards across all CRE loan categories tightened further in the second quarter and that banks expected to tighten CRE standards further over the second half of the year. Meanwhile, CMBS issuance picked up a bit in May and then ticked down in June after recording low volumes earlier in the year.

Credit in the residential mortgage market remained broadly available for high-credit-score borrowers who met standard conforming loan criteria. Only modest net percentages of banks in the July SLOOS reported tightening standards for mortgage loans eligible to be purchased by government-sponsored enterprises, while a moderate net percentage of banks reported expecting to tighten lending standards further for these loans over the second half of the year. Meanwhile, the availability of mortgage credit remained tighter for households with lower credit scores, at levels close to those prevailing before the pandemic. Banks reported in the SLOOS that they had tightened standards for certain categories of residential real estate loans to be held on their balance sheets, such as jumbo loans and home equity lines of credit. In addition, banks reported expecting to tighten standards for jumbo loans during the remainder of 2023.

Conditions remained generally accommodative in consumer credit markets, with credit available for most borrowers. Credit card balances increased in the second quarter, though at a somewhat slower pace than in previous months. In the July SLOOS, banks reported expecting to continue tightening lending standards for credit card loans.

Overall, the credit quality of most businesses and households remained solid. While there were signs of deterioration in credit quality in some sectors, such as the office segment of CRE, delinquency rates generally remained near their pre-pandemic lows. The credit quality of C&I and CRE loans on banks’ balance sheets remained sound as of the end of the first quarter of 2023. However, in the July SLOOS, banks frequently cited concerns about the credit quality of both CRE and other loans as reasons for expecting to tighten their lending standards over the remainder of the year. Aggregate delinquency rates on pools of commercial mortgages backing CMBS increased in May and June.

The staff provided an update on its assessment of the stability of the financial system and, on balance, characterized the financial vulnerabilities of the U.S. financial system as notable. The staff judged that asset valuation pressures remained notable. In particular, measures of valuations in both residential and commercial property markets remained high relative to fundamentals. House prices, while having cooled earlier this year, started to rise again, and price-to-rent ratios remained at elevated levels and near those seen in the mid-2000s. Al­though commercial property prices moved down, developments in the CRE sector following the pandemic may have produced a permanent shift away from traditional working patterns. If so, fundamentals in the sector could decline notably and contribute to a deterioration in credit quality.

The staff assessed that vulnerabilities associated with household and nonfinancial business leverage remained moderate overall. Aggregate household debt growth remained in line with income growth. While nonfinancial businesses remained highly leveraged and thus vulnerable to shocks, firms’ debt growth has been relatively subdued recently, and their ability to service that debt has been quite high, even among lower-rated firms. Leverage in the financial sector was characterized as notable. In the banking sector, regulatory risk-based capital ratios showed the system remained well capitalized. However, while the overall banking system retained ample loss-bearing capacity, some banks experienced sizable declines in the fair value of their assets as a consequence of rising interest rates. Vulnerabilities associated with funding risks were also characterized as notable. Al­though a small number of banks saw notable outflows of deposits late in the first quarter and early in the second quarter, deposit flows later stabilized.

Staff Economic Outlook
The economic forecast prepared by the staff for the July FOMC meeting was stronger than the June projection. Since the emergence of stress in the banking sector in mid-March, indicators of spending and real activity had come in stronger than anticipated; as a result, the staff no longer judged that the economy would enter a mild recession toward the end of the year. However, the staff continued to expect that real GDP growth in 2024 and 2025 would run below their estimate of potential output growth, leading to a small increase in the unemployment rate relative to its current level.

The staff continued to project that total and core PCE price inflation would move lower in coming years. Much of the step-down in core inflation was expected to occur over the second half of 2023, with forward-looking indicators pointing to a slowing in the rate of increase of housing services prices and with core nonhousing services prices and core goods prices expected to decelerate over the remainder of 2023. Inflation was anticipated to ease further over 2024 as demand–supply imbalances continued to resolve; by 2025, total PCE price inflation was expected to be 2.2 percent, and core inflation was expected to be 2.3 percent.

The staff continued to judge that the risks to the baseline projection for real activity were tilted to the downside. Risks to the staff’s baseline inflation forecast were seen as skewed to the upside, given the possibility that inflation dynamics would prove to be more persistent than expected or that further adverse shocks to supply conditions might occur. Moreover, the additional monetary policy tightening that would be necessitated by higher or more persistent inflation represented a downside risk to the projection for real activity.

2.4B GME net-short shares have accumulated, at weighted average price of $20.38, since July 2019

Categories2023q3 Issue-3, Gamestop., Issue 2023Q3

From: https://www.reddit.com/r/Superstonk/comments/15nkbse/update_24b_gme_netshort_shares_have_accumulated/?rdt=34376

The honorable u/  tinyDrunkElf writes:

Update: 2.4B GME net-short shares have accumulated, at weighted average price of $20.38, since July 2019. This 2.4B shares is NOT short interest, it is the aggregation of each day’s net short volume.

first off, this is NOT short interest

it is the aggregation of each day’s net short volume

yes, these numbers are the same as last time

Short average price has changed a bit as well as long average price, but the counts are essentially the same as two weeks ago.

The Charts

  1. Close price, 50-day simple moving average, weighted short open price
  2. Daily volume as a % of outstanding.
  3. Short volume as % of daily volume. Bubbles scale to % of volume of outstanding. 50-day simple moving average.
  4. Accumulation of: addition of short volume greater than 50%, subtraction of short volume less than 50%.

wut mean

  • ever wonder if shorts have closed? this is a look into daily short volume
  • this is two data sets, (1) price and volume, and (2) daily short volume
  • assuming that short volume below 50% means long buys outnumber short orders (and that shorts are closing)
  • we can capture the bits over or under 50% we can add or subtract to a running tally of the “net shorts”.
  • an example, 66% short volume on 1M shares
    • 66% – 50% = 16%
    • 16% * 1M = 160k
    • 160k is the amount of new “net shorts” for the day
  • the close price can also be factored in to the daily “net short” to get a weighted average of the price where the shorts were opened
  • check my previous posts for more in-depth explanation

why do

I’ve invested and lost money in the stock market, and can now clearly see the market is manipulated and do not like that.

Neither paid to do or not do. I am invested in GME.

GME Analysis (image link):

Comparisons:

Symbol Industry Reason included
‘popcorn’ entertainment common comparison
‘car van uh’ automobile meme stock, a XRT holding
GME retail, electronics, gaming, entertainment meme stock, the SuperStonk, a XRT holding
‘yellow tag retail’ retail, electronics stable comparison
‘eff motor co’ automobile superstonk suggested
‘gee ee’ electronics superstonk suggested
‘gaming cards and CPUs’ electronics, gaming stable comparison
‘big blue retail’ retail stable comparison
‘fancy ecar’ automobile meme stock
‘smile box’ retail stable comparison
’em ess eff tee’ tech stable comparison
‘ex arr tee’ retail equal weight ETF, holds many retail companies
‘towel’ retail meme stock, cellar box example, failed company example
‘yello trucking’ retail, shipping recent market activity, failed company example

Data:

TICKER net-short_aggregate / outstanding total net-short minus net-long total daily net-short shares total daily net-long shares net-short w-avg net-long w-avg outstanding d start d end total volume total-short volume total-short w-average total-long volume total-long w-average current market cap short price * net short total shares last close * net short total shares short agg profit/loss
‘popcorn’ 1.33 688.05M 3.67B 2.98B $10.98 $15.25 519.19M 8/10/2018 8/9/2023 39.18B 19.94B $13.29 19.25B $14.03 $2.54B $9.14B $3.37B $5.77B
‘car van uh’ 5.93 629.05M 832.22M 203.16M $52.24 $48.26 106.07M 8/10/2018 8/9/2023 6.51B 3.57B $44.88 2.94B $43.02 $4.4B $28.23B $26.07B $2.16B
GME 7.87 2.4B 3.63B 1.24B $19.55 $11.55 304.68M 8/10/2018 8/9/2023 24.78B 13.59B $20.38 11.19B $19.67 $6.07B $48.83B $47.76B $1.08B
‘yellow tag retail’ 0.97 212.07M 324.42M 112.35M $82.76 $92.56 218.05M 8/10/2018 8/9/2023 2.4B 1.31B $86.31 1.1B $88 $17.24B $18.3B $16.76B $1.54B
‘eff motor co’ 0.79 3.14B 6.31B 3.17B $8.74 $14.17 4B 8/10/2018 8/9/2023 64.81B 33.97B $11.48 30.83B $12.31 $50.92B $36.04B $39.97B -$3.94B
‘gee ee’ -0.87 959.62M 337.75M 1.3B $69.44 $63.98 1.1B 8/10/2018 8/9/2023 10.42B 4.73B $65.84 5.69B $65.2 $123.39B n/a n/a n/a
‘gaming cards and CPUs’ 1.68 2.71B 5.72B 3.01B $71.36 $71.06 1.61B 8/1 ‘yello trucking’ -0.79 41M 41.79M 82.8M $3.19 $6.02 51.98M 2/8/2021 8/9/2023
0/2018 8/9/2023 61.67B 32.19B $74.44 29.48B $74.69 $178.01B $201.38B $298.85B -$97.47B
‘big blue retail’ -0.28 764.64M 240.87M 1.01B $126.1 $133.95 2.7B 8/10/2018 8/9/2023 6.76B 3B $130.67 3.76B $131.84 $433.76B n/a n/a n/a
‘fancy ecar’ 2.3 7.29B 11.83B 4.54B $121.99 $145.91 3.16B 8/10/2018 8/9/2023 111.82B 59.56B $132.95 52.27B $136.56 $766.31B $969.3B $1.77T -$796.39B
‘smile box’ -0.36 3.69B 2.16B 5.85B $121.97 $122.16 10.26B 8/10/2018 8/9/2023 57.57B 26.94B $124.43 30.63B $124.17 $1.41T n/a n/a n/a
’em ess eff tee’ -0.25 1.88B 764.6M 2.65B $210.3 $223.65 7.44B 8/10/2018 8/9/2023 19.48B 8.8B $218.21 10.68B $220.13 $2.4T n/a n/a n/a
‘ex arr tee’ 239.18 1.47B 1.5B 31.72M $56.04 $72.13 6.15M 8/10/2018 8/9/2023 4.18B 2.83B $58.24 1.36B $61.01 $405.84M $85.67B $97.07B -$11.4B
‘towel’ 12.12 1.1B 1.69B 586.42M $8.39 $12.21 90.71M 8/10/2018 5/2/2023 15.69B 8.39B $7.93 7.29B $8.16 $6.81M $8.71B $82.56M $8.63B
‘yello trucking’ -0.79 41M 41.79M 82.8M $3.19 $6.02 51.98M 2/8/2021 8/9/2023 931.39M 445.19M $3.75 486.2M $4.18 $88.37M n/a n/a n/a

This is NOT short interest

  • As has been pointed out many times, by myself and by others: This is NOT short interest.
  • This is an analysis and interpretation of the daily short volume.
  • Short interest is very very special and FINRA has special rules for what it is and how it is reported.

NOT short interest? Then what is it?

This is a short volume artifact (or “indicator”). There is known unreliability due to self-reported nature of the data.

Come with me on a journey of the discovery of electricity. Starting with silk and amber in 600BCE, then frog legs, then electric ticklers, and eventually a connection to magnetism and motors, lights, and batteries. Total time to get there? Just, like 2,400 years… Sometimes the incremental bits have no point, and need to be built upon.

I’m not a TA master-of-the-dark-arts, I am just exploring some of the raw data in a fairly simple way. It seems unlikely that this method would been unexplored. However, if it has been done, it doesn’t seem like it’s widely referenced.

My previous posts explain this artifact and methods used.

My basic summary of the value of GME

  1. Current Value. GME company value as a ‘normal’ specialized retail company who sells games and gaming products to an established and growing market. Fundamentals, Quarterly numbers, assets, etc.
  2. Future Value. Shareholder belief, belief in the mission/essense of the company. Is GME more than a video game retailor? Can it be more?
  3. The Squeeze. Based on 1 and 2, have shorts and market makers oversold the company?
  • DRS is a factor that has removed shares from liquidity, a reported ~25% of outstanding have been DRSed and removed from the liquidity pool at the DTC.
  • Continued low volume
  • Market maker / short hedge fund activities
  • When gamers see an exploit or advantage in a game, they lean into it – same as anyone, find a loophole and exploit it. SHFs leaned into their shorts. Retail investors are leaning back.

While I’ve got my soapbox out:

for RC: Seems like GME has a tricky problem. How do you get people to work on a rocketship and stay? From what I can see, you need to hire those who have transcended space and time who ride the rocket for the sheer joy of it.

for LC:


r/Superstonk - You guys are trying to prove things?
You guys are trying to prove things?

Power to the players. Power to the creators. Please. Help us help you. Help us help ourselves.

Data interpretations

There’s been a bit of a plateau since my last post, the numbers are surprisingly the same, net shorting seems to have evened out a bit, especially with low volume.

Added a few more columns to the table, multiplying share counts and prices to get estimates for outstanding quantities.

$20.38 is the weighted average short open price for the total 13.59B short shares since July 2019. This can be thought of as representing bearish sentinment.

$19.67 is the weighted average long open price for the total 11.19B total long shares since July 2019. This can be thought of as representing bullish sentiment.

13.59B – 11.19B = 2.4B.

2.4B net shares shorted have accumulated on the public feed since July 2019. This is the aggregate “short minus long” for this time period. – this is important, this 2.4B number is NOT short interest – this 2.4B number is simply the accumulated net short volume since July 2019, it is not short interest

NEW

“$1.08B” paper gain for shorts as of close on 8/9/2023

  • (2.4B shares TIMES (20.38 – 20.74))
  • assuming the $20.38 average short price is valid.

Put another way: every $1 dollar in price below/above $20.38 is $2.4B in gain/loss/liability. $10 up to $30.38? $24B loss. $15 more to bring us to $45.38 (battle for $180 territory)? $25 * 2.4B = $60B loss. Peak squeeze at ~$483? 483/4 = 120, 120-20.38 = $99.62. $99.62 * 2.4 = $239B loss.

Based on this analysis, this ($1.08B) is the total potential gain/loss/liability shorts were sitting on when the price closed Wednesday 8/9 at $19.93.

“-$869.17M” (2.4B shares TIMES (20.38 – 19.93)) Based on this analysis, this ($869.17M) is the total potential gain/loss/liability shorts were sitting on when the price closed Tuesday 8/8 at $20.74.

Sold, not yet purchased

Shares sold but not yet purchased, at fair market value.

What does that even mean? It means market makers can sell shares that don’t exist to provide liquidity. The idea is that they will then buy them back at a similar price at which they sold them, when they are able. Naked short selling by market makers isn’t illegal.


r/Superstonk - Update: 2.4B GME net-short shares have accumulated, at weighted average price of $20.38, since July 2019. This 2.4B shares is NOT short interest, it is the aggregation of each day's net short volume.


it may take a market maker considerable time to purchase or arrange to borrow the security…

TLDR

$20.38 weighted average short open price for the total 13.59B short shares since July 2019. This can be thought of as representing bearish sentinment.

$19.67 is the weighted average long open price for the total 11.19B total long shares since July 2019. This can be thought of as representing bullish sentiment.

2.4B net shares shorted have accumulated on the public feed since July 2019. This is the aggregate “short minus long” for this time period.

wut

Price can’t rise, because margin.

Shorts can’t close because price rises when buying.

Shorts never closed. Still probably can’t. Wut du?

Swap ’em and lock ’em. Then hide the key for 50 years?

A deep dive into the shrinking money supply: Banks get sweetheart programs from the liquidity fairy while households are forced to take on debt and in some instances DIE while being priced out of their lives in favor of rising interest rates to fight an inflation problem the Fed created.

CategoriesGamestop_, Gamestop., Issue 2023Q2

by u/ Dismal-Jellyfish

Good morning and Happy Wednesday Superstonk! Before I get started, fun fact, did you know a group of jellyfish is called a smack?

With that, I hope y’all will join me as we ‘smack this fish up‘ while we dive into today’s topic: Shrinking M2.

I would like to take a minute to review some of the data around the shrinking money stock, the borrowing banks are able to take utilize vs the debt households are taking on.

I hope by the end of this post, it will be clear that Banks and Households are not experiencing this current economic environment the same way.

In my opinion, inflation is the big bad boogey man that has kicked off the need for all of this borrowing.

While this post is not about inflation specifically, it is fascinating to watch inflation continue to rage even as money stock continues to drop.

Let’s get to it!

M2 (U.S. money stock–currency and coins held by the non-bank public, checkable deposits, and travelers’ checks, plus savings deposits, small time deposits under 100k, and shares in retail money market funds) is decreasing:

https://fred.stlouisfed.org/series/M2SL
https://www.federalreserve.gov/releases/h6/current/default.htm
  1. M1 consists of (1) currency outside the U.S. Treasury, Federal Reserve Banks, and the vaults of depository institutions; (2) demand deposits at commercial banks (excluding those amounts held by depository institutions, the U.S. government, and foreign banks and official institutions) less cash items in the process of collection and Federal Reserve float; and (3) other liquid deposits, consisting of other checkable deposits (or OCDs, which comprise negotiable order of withdrawal, or NOW, and automatic transfer service, or ATS, accounts at depository institutions, share draft accounts at credit unions, and demand deposits at thrift institutions) and savings deposits (including money market deposit accounts). Seasonally adjusted M1 is constructed by summing currency, demand deposits, and other liquid deposits, each seasonally adjusted separately.
  2. M2 consists of M1 plus (1) small-denomination time deposits (time deposits in amounts of less than $100,000) less individual retirement account (IRA) and Keogh balances at depository institutions; and (2) balances in retail money market funds (MMFs) less IRA and Keogh balances at MMFs. Seasonally adjusted M2 is constructed by summing small-denomination time deposits and retail MMFs, each seasonally adjusted separately, and adding the result to seasonally adjusted M1.
  3. Currency in circulation consists of Federal Reserve notes and coin outside the U.S. Treasury and Federal Reserve Banks.
  4. Reserve balances are balances held by depository institutions in master accounts and excess balance accounts at Federal Reserve Banks.
  5. Monetary base equals currency in circulation plus reserve balances.
  6. Total reserves equal reserve balances plus, before April 2020, vault cash used to satisfy reserve requirements.
  7. Total borrowings in millions of dollars from the Federal Reserve are borrowings from the discount window’s primary, secondary, and seasonal credit programs and other borrowings from emergency lending facilities. For borrowings included, see “Loans” in table 1 of the H.4.1 statistical release.
  8. Nonborrowed reserves equal total reserves less total borrowings from the Federal Reserve.

A little less than a year ago (July 2022) the M2 high was hit at $21,703 billion

Date M2 (billions) Down from all time high (billions)
July 2022 $21,703 0
August 2022 $21,660 -$43 billion
September 2022 $21,524 -$179 billion
October 2022 $21,432 -$271 billion
November 2022 $21,398 -$305 billion
December 2022 $21,358 -$345 billion
January 2023 $21,212 -$491 billion
February 2023* $21,076 -$627 billion
March 2023 $20,840 -$863 billion
April 2023 $20,673 -$1030 billion

*Bank run in commercial banks picked up in February 2022.

While M2 is dropping, deposits at all Commercial Banks are Shrinking:

Source: https://www.federalreserve.gov/releases/h8/20230519/
https://fred.stlouisfed.org/series/DPSACBW027SBOG

Domestically chartered commercial banks divested $87 billion in assets to nonbank institutions in the week ending March 29, 2023. The major asset item affected was the following: securities, $87 billion.

Domestically chartered commercial banks divested $87 billion in assets to nonbank institutions in the week ending March 22, 2023. The major asset items affected were the following: securities, $27 billion; and loans, $60 billion.

A little over a year ago (4/13/2022) the high was hit at $18,158.3536 billion

Date Deposits, All Commercial Banks (billions) Down from all time high (billions)
4/13/2022 $18,158 0
2/22/2023 (Run picks up speed) $17,690 -$468 billion
3/1/2023 $17,662 -$496 billion
3/8/2023 $17,599 -$559 billion
3/15/2023 $17,428 -$730 billion
3/22/2023 $17,256 -$902 billion
3/29/2023 $17,192 -$966 billion
4/5/2023 $17,253 -$905 billion
4/12/2023 $17,168 -$990 billion
4/19/2023 $17,180 -$978 billion
4/26/2023* $17,164 -$994 billion
5/3/2023 $17,149 -$1,009 billion
5/10/2023 $17,123 -$1,035 billion

*April is the most up to date M2 numbers

However, borrowing from the liquidity fairy is spiraling to make up for it!:

Bank Term Funding Program (BTFP)

https://fred.stlouisfed.org/series/H41RESPPALDKNWW
Tool Bank Term Funding Program (BTFP) Up from 3/15, 1st week of program ($ billion)
3/15) $11.943 billion $0 billion
3/22 $53.669 billion $41.723 billion
3/29 $64.403 billion $52.460 billion
3/31 $64.595 billion $52.652 billion
4/5 $79.021 billion $67.258 billion
4/12 $71.837 billion $59.894 billion
4/19 $73.982 billion $62.039 billion
4/26 $81.327 billion $69.384 billion
5/3 $75,778 billion $63.935 billion
5/10 $83,101 billion $71.158 billion
5/17 $87,006 billion $75.063 billion


r/Superstonk - https://www.reddit.com/r/Superstonk/comments/11prthd/federal_reserve_alert_federal_reserve_board/
https://www.reddit.com/r/Superstonk/comments/11prthd/federal_reserve_alert_federal_reserve_board/
  • Association, or credit union) or U.S. branch or agency of a foreign bank that is eligible for primary credit (see 12 CFR 201.4(a)) is eligible to borrow under the Program.
  • Banks can borrow for up to one year, at a fixed rate for the term, pegged to the one-year overnight index swap rate plus 10 basis points.
  • Banks have to post collateral (valued at par!).
  • Any collateral has to be “owned by the borrower as of March 12, 2023.”
  • Eligible collateral includes any collateral eligible for purchase by the Federal Reserve Banks in open market operations.

“Other credit extensions”

https://fred.stlouisfed.org/series/WLCFOCEL
Tool Other Credit Extension Up from 3/15, 1st week of program ($ billion)
3/15) $142.8 billion $0 billion
3/22 $179.8 billion $37 billion
3/29 $180.1 billion $37.3 billion
4/5 $174.6 billion $31.8 billion
4/12 $172.6 billion $29.8 billion
4/19 $172.6 billion $29.8 billion
4/26 $170.3 billion $27.5 billion
5/3 $228.2 billion $85.4 billion
5/10 $212.5 billion $69.7billion
5/17 $208.5 billion $65.7 billion

“Other credit extensions” includes loans that were extended to depository institutions established by the Federal Deposit Insurance Corporation (FDIC). The Federal Reserve Banks’ loans to these depository institutions are secured by collateral and the FDIC provides repayment guarantees.

For example, $114 billion in face value Agency Mortgage Backed Securities, Collateralized Mortgage Obligations, and Commercial Mortgage Backed Securities about to be liquidated ‘gradual and orderly’ with the ‘aim to minimize the potential for any adverse impact on market functioning’ by BlackRock.

How I understand this works:

  • The FDIC created temporary banks to support the operations of the ones they have taken over.
  • The FDIC did not have the money to operate these banks.
  • The Fed is providing that in the form of a loan via “Other credit extensions”.
  • The FDIC is going to sell the taken over banks assets.
  • Whatever the difference between the sale of the assets and the ultimate loan number is, will be the amount split up amongst all the remaining banks and applied as a special fee to make the Fed ‘whole’.
  • It can be argued the consumer will ultimately end up paying for this as banks look to pass this cost on in some way.

There has been an update on this piece recently:

Whatever the difference between the sale of the assets and the ultimate loan number is, will be the amount split up amongst all the remaining banks and applied as a special fee to make the Fed ‘whole’.

FDIC Board of Directors Issues a Proposed Rule on Special Assessment Pursuant to Systemic Risk Determination of approximately $15.8 billion. It is estimated that a total of 113 banking organizations would be subject to the special assessment.

https://www.fdic.gov/news/fact-sheets/systemic-risk-determination-5-11-23.html

What does all this borrowing look like for the banks?

https://www.reddit.com/r/Superstonk/comments/13eme4d/bank_funding_during_the_current_monetary_policy/

Over the few weeks prior to the FDIC receivership announcements on March 10 and 12, the banking sector lost another approximately $450 billion. Throughout, the banking sector has offset the reduction in deposit funding with an increase in other forms of borrowing which has increased by $800 billion since the start of the tightening.

The right panel of the chart below summarizes the cumulative change in deposit funding by bank size category since the start of the tightening cycle through early March 2023 and then through the end of March. Until early March 2023, the decline in deposit funding lined up with bank size, consistent with the concentration of deposits in larger banks. Small banks lost no deposit funding prior to the events of late March. In terms of percentage decline, the outflows were roughly equal for regional, super-regional, and large banks at around 4 percent of total deposit funding:

The blue bar in the left panel above shows that the pattern changes following the run on SVB. The additional outflow is entirely concentrated in the segment of super-regional banks. In fact, most other size categories experience deposit inflows.

The right panel illustrates that outflows at super-regionals begin immediately after the failure of SVB and are mirrored by deposit inflows at large banks in the second week of March 2022.

Further, while deposit funding remains at a lower level throughout March for super-regional banks, the initially large inflows mostly reverse by the end of March. Notably, banks with less than $100 billion in assets were relatively unaffected.

However, during the most acute phase of banking stress in mid-March, other borrowings exceeded reductions in deposit balances, suggesting significant and widespread demand for precautionary liquidity. A substantial amount of liquidity was provided by the private markets, likely via the FHLB system, but primary credit and the Bank Term Funding Program (both summarized as Federal Reserve credit) were equally important.

  • Large banks increased borrowing the most, which is in line with deposit outflows being strongest for larger banks before March 2023.
  • During March 2023, both super-regional and large banks increase their borrowings, with most increases being centered in the super-regional banks that faced the largest deposit outflows.
  • Note, however, that not all size categories face deposit outflows but that all except the small banks increase their other borrowings.
  • This pattern suggests demand for precautionary liquidity buffers across the banking system, not just among the most affected institutions:
  • So, on the commercial side, as M2 has been shrinking, the banking system has seen a considerable decline in deposit funding since the start of the current monetary policy tightening cycle in March 2022.
  • The speed of deposit outflows increased during March 2023, following the run on SVB, with the most acute outflows concentrated in a relatively narrow segment of the banking system, super-regional banks (those with $50 to $250 billion in total assets).
  • Notably, deposit funding amongst the cohort often referred to as community and smaller regional banks (that is, institutions with less than $50 billion in assets) were relatively stable by comparison.
  • Large banks (those with more than $250 billion in assets), which had been subject to the largest deposit outflows before March 2023, received deposit inflows throughout March 2023.
  • Throughout, banks were able to replace deposit outflows by making use of alternative funding sources–FHLB, Primary Credit, BTFP.

Banks get liquidity while ‘we’ get inflations and rate hikes. Speaking of households…

During this same period, Household borrowing has also skyrocketed!

From 1st quarter 2022 to 1st quarter 2023, total household debt has increased $1,205 billion to $17.05 trillion (+7.57%)–Mortgage balances ($864 billion), HELOC ($22 billion), Student loans ($14 billion), Auto loans ($93 billion), Credit Card debt ($145 billion), Other ($67 billion):

  • Total household debt has risen by $148 billion, or 0.9 percent, to $17.05 trillion in the first quarter of 2023.
  • Mortgage balances climbed by $121 billion and stood at $12.04 trillion at the end of March.
  • Auto loans to $1.56 trillion.
  • Student loans to $1.60 trillion.
  • Credit Card debt $986 billion.

However, unlike the banks above, there are no fancy programs designed to keep households afloat in this inflating economy–and boy are households starting to feel it, especially in the areas like services and housing (that are BIG components of CPI–and way more ‘sticky’ than goods).

For example, on the housing front:

April 2023 Rental Report: The median asking rent was $1,734, up by $4 from last month and down by $43 from the peak but still $348 (25.1%) higher than the same time in 2019 (pre-pandemic)

To try and further drive home the shaky ground households are on, let’s revisit the Fed’s Economic Well-being US Household 2022.

  • “fewer adults reported having money left over after paying their expenses. 54% of adults said that their budgets had been affected “a lot” by price increases.”
  • “51% of adults reported that they reduced their savings in response to higher prices.”
  • The share of adults who reported that they would cover a $400 emergency expense using cash or its equivalent was 63 percent.

It is the younger generations starting to see itself break into delinquency now:

  • Auto loans are above 3% delinquency for (30-39) and approaching 5% for (18-29)
  • Credit Cards are above 6% delinquency for (30-39) and approaching 9% for (18-29)
  • Student Loan delinquency is being artificially suppressed currently.
    • Speculation: when folks (18-29) and (30-39) have to pay Auto loans, Credit Card dent, and Student loans all at the same time, delinquencies across all 3 will jump bigly.
    • People will DIE being priced out of their lives in favor of raising interest rates to fight inflation for a problem the Fed created to begin with:

TLDRS:

  • M2 is shrinking
  • Borrowing is up
    • Banks have access to sweetheart programs from the liquidity fairy.
    • Households are taking on debt that is literally killing them.
  • Some fed governors are calling for 2 more rate hikes this year
r/Superstonk - A deep dive into the shrinking money supply: Banks get sweetheart programs from the liquidity fairy while households are forced to take on debt and in some instances DIE while being priced out of their lives in favor of rising interest rates to fight an inflation problem the Fed…

ONYX: is JP Morgan using its Onyx program to rehypothecate BlackRock’s MMF’s balance sheet/treasuries (overnight repo market) and using them as collateral…by making BlackRock’s treasuries into tokenized stocks?

CategoriesGamestop., GME

Continue reading “ONYX: is JP Morgan using its Onyx program to rehypothecate BlackRock’s MMF’s balance sheet/treasuries (overnight repo market) and using them as collateral…by making BlackRock’s treasuries into tokenized stocks?”