by u/ Dismal-Jellyfish
Good morning and Happy Wednesday Superstonk! Before I get started, fun fact, did you know a group of jellyfish is called a smack?
With that, I hope y’all will join me as we ‘smack this fish up‘ while we dive into today’s topic: Shrinking M2.
I would like to take a minute to review some of the data around the shrinking money stock, the borrowing banks are able to take utilize vs the debt households are taking on.
I hope by the end of this post, it will be clear that Banks and Households are not experiencing this current economic environment the same way.
In my opinion, inflation is the big bad boogey man that has kicked off the need for all of this borrowing.
While this post is not about inflation specifically, it is fascinating to watch inflation continue to rage even as money stock continues to drop.
Let’s get to it!
M2 (U.S. money stock–currency and coins held by the non-bank public, checkable deposits, and travelers’ checks, plus savings deposits, small time deposits under 100k, and shares in retail money market funds) is decreasing:


- M1 consists of (1) currency outside the U.S. Treasury, Federal Reserve Banks, and the vaults of depository institutions; (2) demand deposits at commercial banks (excluding those amounts held by depository institutions, the U.S. government, and foreign banks and official institutions) less cash items in the process of collection and Federal Reserve float; and (3) other liquid deposits, consisting of other checkable deposits (or OCDs, which comprise negotiable order of withdrawal, or NOW, and automatic transfer service, or ATS, accounts at depository institutions, share draft accounts at credit unions, and demand deposits at thrift institutions) and savings deposits (including money market deposit accounts). Seasonally adjusted M1 is constructed by summing currency, demand deposits, and other liquid deposits, each seasonally adjusted separately.
- M2 consists of M1 plus (1) small-denomination time deposits (time deposits in amounts of less than $100,000) less individual retirement account (IRA) and Keogh balances at depository institutions; and (2) balances in retail money market funds (MMFs) less IRA and Keogh balances at MMFs. Seasonally adjusted M2 is constructed by summing small-denomination time deposits and retail MMFs, each seasonally adjusted separately, and adding the result to seasonally adjusted M1.
- Currency in circulation consists of Federal Reserve notes and coin outside the U.S. Treasury and Federal Reserve Banks.
- Reserve balances are balances held by depository institutions in master accounts and excess balance accounts at Federal Reserve Banks.
- Monetary base equals currency in circulation plus reserve balances.
- Total reserves equal reserve balances plus, before April 2020, vault cash used to satisfy reserve requirements.
- Total borrowings in millions of dollars from the Federal Reserve are borrowings from the discount window’s primary, secondary, and seasonal credit programs and other borrowings from emergency lending facilities. For borrowings included, see “Loans” in table 1 of the H.4.1 statistical release.
- Nonborrowed reserves equal total reserves less total borrowings from the Federal Reserve.
A little less than a year ago (July 2022) the M2 high was hit at $21,703 billion
| Date | M2 (billions) | Down from all time high (billions) |
|---|---|---|
| July 2022 | $21,703 | 0 |
| August 2022 | $21,660 | -$43 billion |
| September 2022 | $21,524 | -$179 billion |
| October 2022 | $21,432 | -$271 billion |
| November 2022 | $21,398 | -$305 billion |
| December 2022 | $21,358 | -$345 billion |
| January 2023 | $21,212 | -$491 billion |
| February 2023* | $21,076 | -$627 billion |
| March 2023 | $20,840 | -$863 billion |
| April 2023 | $20,673 | -$1030 billion |
*Bank run in commercial banks picked up in February 2022.
While M2 is dropping, deposits at all Commercial Banks are Shrinking:


Domestically chartered commercial banks divested $87 billion in assets to nonbank institutions in the week ending March 29, 2023. The major asset item affected was the following: securities, $87 billion.
Domestically chartered commercial banks divested $87 billion in assets to nonbank institutions in the week ending March 22, 2023. The major asset items affected were the following: securities, $27 billion; and loans, $60 billion.
A little over a year ago (4/13/2022) the high was hit at $18,158.3536 billion
| Date | Deposits, All Commercial Banks (billions) | Down from all time high (billions) |
|---|---|---|
| 4/13/2022 | $18,158 | 0 |
| 2/22/2023 (Run picks up speed) | $17,690 | -$468 billion |
| 3/1/2023 | $17,662 | -$496 billion |
| 3/8/2023 | $17,599 | -$559 billion |
| 3/15/2023 | $17,428 | -$730 billion |
| 3/22/2023 | $17,256 | -$902 billion |
| 3/29/2023 | $17,192 | -$966 billion |
| 4/5/2023 | $17,253 | -$905 billion |
| 4/12/2023 | $17,168 | -$990 billion |
| 4/19/2023 | $17,180 | -$978 billion |
| 4/26/2023* | $17,164 | -$994 billion |
| 5/3/2023 | $17,149 | -$1,009 billion |
| 5/10/2023 | $17,123 | -$1,035 billion |
*April is the most up to date M2 numbers
However, borrowing from the liquidity fairy is spiraling to make up for it!:
Bank Term Funding Program (BTFP)

| Tool | Bank Term Funding Program (BTFP) | Up from 3/15, 1st week of program ($ billion) |
|---|---|---|
| 3/15) | $11.943 billion | $0 billion |
| 3/22 | $53.669 billion | $41.723 billion |
| 3/29 | $64.403 billion | $52.460 billion |
| 3/31 | $64.595 billion | $52.652 billion |
| 4/5 | $79.021 billion | $67.258 billion |
| 4/12 | $71.837 billion | $59.894 billion |
| 4/19 | $73.982 billion | $62.039 billion |
| 4/26 | $81.327 billion | $69.384 billion |
| 5/3 | $75,778 billion | $63.935 billion |
| 5/10 | $83,101 billion | $71.158 billion |
| 5/17 | $87,006 billion | $75.063 billion |
- Association, or credit union) or U.S. branch or agency of a foreign bank that is eligible for primary credit (see 12 CFR 201.4(a)) is eligible to borrow under the Program.
- Banks can borrow for up to one year, at a fixed rate for the term, pegged to the one-year overnight index swap rate plus 10 basis points.
- Banks have to post collateral (valued at par!).
- Any collateral has to be “owned by the borrower as of March 12, 2023.”
- Eligible collateral includes any collateral eligible for purchase by the Federal Reserve Banks in open market operations.
“Other credit extensions”
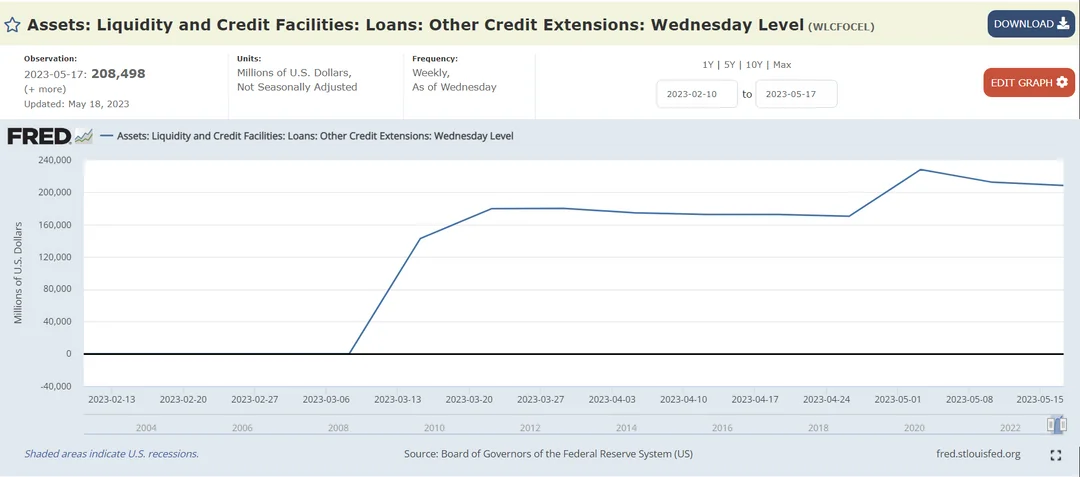
| Tool | Other Credit Extension | Up from 3/15, 1st week of program ($ billion) |
|---|---|---|
| 3/15) | $142.8 billion | $0 billion |
| 3/22 | $179.8 billion | $37 billion |
| 3/29 | $180.1 billion | $37.3 billion |
| 4/5 | $174.6 billion | $31.8 billion |
| 4/12 | $172.6 billion | $29.8 billion |
| 4/19 | $172.6 billion | $29.8 billion |
| 4/26 | $170.3 billion | $27.5 billion |
| 5/3 | $228.2 billion | $85.4 billion |
| 5/10 | $212.5 billion | $69.7billion |
| 5/17 | $208.5 billion | $65.7 billion |
“Other credit extensions” includes loans that were extended to depository institutions established by the Federal Deposit Insurance Corporation (FDIC). The Federal Reserve Banks’ loans to these depository institutions are secured by collateral and the FDIC provides repayment guarantees.
How I understand this works:
- The FDIC created temporary banks to support the operations of the ones they have taken over.
- The FDIC did not have the money to operate these banks.
- The Fed is providing that in the form of a loan via “Other credit extensions”.
- The FDIC is going to sell the taken over banks assets.
- Whatever the difference between the sale of the assets and the ultimate loan number is, will be the amount split up amongst all the remaining banks and applied as a special fee to make the Fed ‘whole’.
- It can be argued the consumer will ultimately end up paying for this as banks look to pass this cost on in some way.
There has been an update on this piece recently:
Whatever the difference between the sale of the assets and the ultimate loan number is, will be the amount split up amongst all the remaining banks and applied as a special fee to make the Fed ‘whole’.

What does all this borrowing look like for the banks?

Over the few weeks prior to the FDIC receivership announcements on March 10 and 12, the banking sector lost another approximately $450 billion. Throughout, the banking sector has offset the reduction in deposit funding with an increase in other forms of borrowing which has increased by $800 billion since the start of the tightening.
The right panel of the chart below summarizes the cumulative change in deposit funding by bank size category since the start of the tightening cycle through early March 2023 and then through the end of March. Until early March 2023, the decline in deposit funding lined up with bank size, consistent with the concentration of deposits in larger banks. Small banks lost no deposit funding prior to the events of late March. In terms of percentage decline, the outflows were roughly equal for regional, super-regional, and large banks at around 4 percent of total deposit funding:

The blue bar in the left panel above shows that the pattern changes following the run on SVB. The additional outflow is entirely concentrated in the segment of super-regional banks. In fact, most other size categories experience deposit inflows.
The right panel illustrates that outflows at super-regionals begin immediately after the failure of SVB and are mirrored by deposit inflows at large banks in the second week of March 2022.
Further, while deposit funding remains at a lower level throughout March for super-regional banks, the initially large inflows mostly reverse by the end of March. Notably, banks with less than $100 billion in assets were relatively unaffected.

- Large banks increased borrowing the most, which is in line with deposit outflows being strongest for larger banks before March 2023.
- During March 2023, both super-regional and large banks increase their borrowings, with most increases being centered in the super-regional banks that faced the largest deposit outflows.
- Note, however, that not all size categories face deposit outflows but that all except the small banks increase their other borrowings.
- This pattern suggests demand for precautionary liquidity buffers across the banking system, not just among the most affected institutions:

- So, on the commercial side, as M2 has been shrinking, the banking system has seen a considerable decline in deposit funding since the start of the current monetary policy tightening cycle in March 2022.
- The speed of deposit outflows increased during March 2023, following the run on SVB, with the most acute outflows concentrated in a relatively narrow segment of the banking system, super-regional banks (those with $50 to $250 billion in total assets).
- Notably, deposit funding amongst the cohort often referred to as community and smaller regional banks (that is, institutions with less than $50 billion in assets) were relatively stable by comparison.
- Large banks (those with more than $250 billion in assets), which had been subject to the largest deposit outflows before March 2023, received deposit inflows throughout March 2023.
- Throughout, banks were able to replace deposit outflows by making use of alternative funding sources–FHLB, Primary Credit, BTFP.
Banks get liquidity while ‘we’ get inflations and rate hikes. Speaking of households…
During this same period, Household borrowing has also skyrocketed!
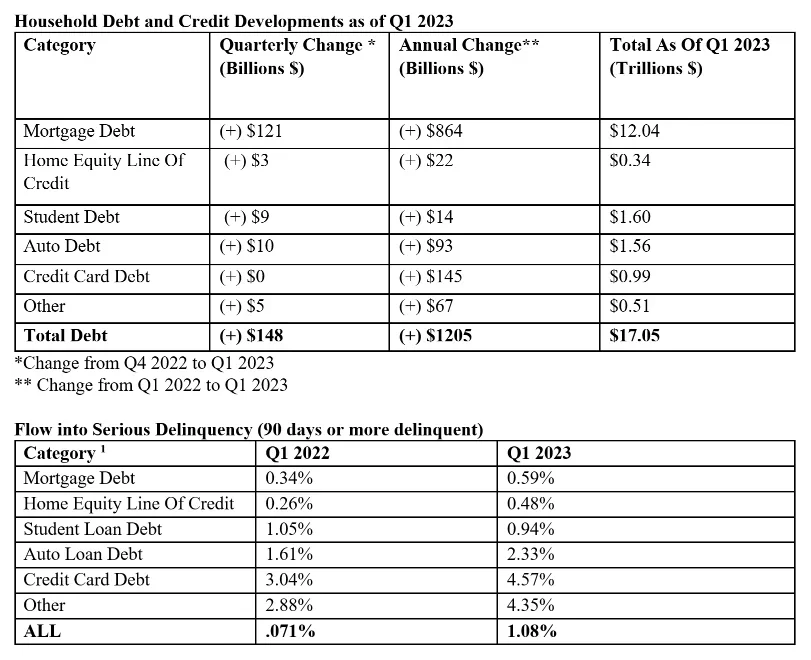

- Total household debt has risen by $148 billion, or 0.9 percent, to $17.05 trillion in the first quarter of 2023.
- Mortgage balances climbed by $121 billion and stood at $12.04 trillion at the end of March.
- Auto loans to $1.56 trillion.
- Student loans to $1.60 trillion.
- Credit Card debt $986 billion.
However, unlike the banks above, there are no fancy programs designed to keep households afloat in this inflating economy–and boy are households starting to feel it, especially in the areas like services and housing (that are BIG components of CPI–and way more ‘sticky’ than goods).
For example, on the housing front:


To try and further drive home the shaky ground households are on, let’s revisit the Fed’s Economic Well-being US Household 2022.
- “fewer adults reported having money left over after paying their expenses. 54% of adults said that their budgets had been affected “a lot” by price increases.”
- “51% of adults reported that they reduced their savings in response to higher prices.”
- The share of adults who reported that they would cover a $400 emergency expense using cash or its equivalent was 63 percent.
It is the younger generations starting to see itself break into delinquency now:

- Auto loans are above 3% delinquency for (30-39) and approaching 5% for (18-29)
- Credit Cards are above 6% delinquency for (30-39) and approaching 9% for (18-29)
- Student Loan delinquency is being artificially suppressed currently.
- Speculation: when folks (18-29) and (30-39) have to pay Auto loans, Credit Card dent, and Student loans all at the same time, delinquencies across all 3 will jump bigly.
- People will DIE being priced out of their lives in favor of raising interest rates to fight inflation for a problem the Fed created to begin with:

TLDRS:
- M2 is shrinking
- Borrowing is up
- Banks have access to sweetheart programs from the liquidity fairy.
- Households are taking on debt that is literally killing them.
- Some fed governors are calling for 2 more rate hikes this year…