The honorable u/ tinyDrunkElf writes:
first off, this is NOT short interest
it is the aggregation of each day’s net short volume
yes, these numbers are the same as last time
Short average price has changed a bit as well as long average price, but the counts are essentially the same as two weeks ago.
The Charts
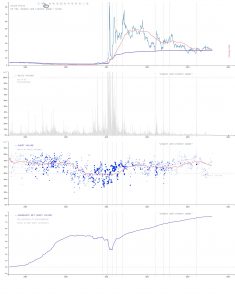
- Close price, 50-day simple moving average, weighted short open price
- Daily volume as a % of outstanding.
- Short volume as % of daily volume. Bubbles scale to % of volume of outstanding. 50-day simple moving average.
- Accumulation of: addition of short volume greater than 50%, subtraction of short volume less than 50%.
wut mean
- ever wonder if shorts have closed? this is a look into daily short volume
- this is two data sets, (1) price and volume, and (2) daily short volume
- assuming that short volume below 50% means long buys outnumber short orders (and that shorts are closing)
- we can capture the bits over or under 50% we can add or subtract to a running tally of the “net shorts”.
- an example, 66% short volume on 1M shares
- 66% – 50% = 16%
- 16% * 1M = 160k
- 160k is the amount of new “net shorts” for the day
- the close price can also be factored in to the daily “net short” to get a weighted average of the price where the shorts were opened
- check my previous posts for more in-depth explanation
why do
I’ve invested and lost money in the stock market, and can now clearly see the market is manipulated and do not like that.
Neither paid to do or not do. I am invested in GME.
GME Analysis (image link):
Comparisons:
| Symbol | Industry | Reason included |
|---|---|---|
| ‘popcorn’ | entertainment | common comparison |
| ‘car van uh’ | automobile | meme stock, a XRT holding |
| GME | retail, electronics, gaming, entertainment | meme stock, the SuperStonk, a XRT holding |
| ‘yellow tag retail’ | retail, electronics | stable comparison |
| ‘eff motor co’ | automobile | superstonk suggested |
| ‘gee ee’ | electronics | superstonk suggested |
| ‘gaming cards and CPUs’ | electronics, gaming | stable comparison |
| ‘big blue retail’ | retail | stable comparison |
| ‘fancy ecar’ | automobile | meme stock |
| ‘smile box’ | retail | stable comparison |
| ’em ess eff tee’ | tech | stable comparison |
| ‘ex arr tee’ | retail | equal weight ETF, holds many retail companies |
| ‘towel’ | retail | meme stock, cellar box example, failed company example |
| ‘yello trucking’ | retail, shipping | recent market activity, failed company example |
Data:
| TICKER | net-short_aggregate / outstanding | total net-short minus net-long | total daily net-short shares | total daily net-long shares | net-short w-avg | net-long w-avg | outstanding | d start | d end | total volume | total-short volume | total-short w-average | total-long volume | total-long w-average | current market cap | short price * net short total shares | last close * net short total shares | short agg profit/loss |
|---|---|---|---|---|---|---|---|---|---|---|---|---|---|---|---|---|---|---|
| ‘popcorn’ | 1.33 | 688.05M | 3.67B | 2.98B | $10.98 | $15.25 | 519.19M | 8/10/2018 | 8/9/2023 | 39.18B | 19.94B | $13.29 | 19.25B | $14.03 | $2.54B | $9.14B | $3.37B | $5.77B |
| ‘car van uh’ | 5.93 | 629.05M | 832.22M | 203.16M | $52.24 | $48.26 | 106.07M | 8/10/2018 | 8/9/2023 | 6.51B | 3.57B | $44.88 | 2.94B | $43.02 | $4.4B | $28.23B | $26.07B | $2.16B |
| GME | 7.87 | 2.4B | 3.63B | 1.24B | $19.55 | $11.55 | 304.68M | 8/10/2018 | 8/9/2023 | 24.78B | 13.59B | $20.38 | 11.19B | $19.67 | $6.07B | $48.83B | $47.76B | $1.08B |
| ‘yellow tag retail’ | 0.97 | 212.07M | 324.42M | 112.35M | $82.76 | $92.56 | 218.05M | 8/10/2018 | 8/9/2023 | 2.4B | 1.31B | $86.31 | 1.1B | $88 | $17.24B | $18.3B | $16.76B | $1.54B |
| ‘eff motor co’ | 0.79 | 3.14B | 6.31B | 3.17B | $8.74 | $14.17 | 4B | 8/10/2018 | 8/9/2023 | 64.81B | 33.97B | $11.48 | 30.83B | $12.31 | $50.92B | $36.04B | $39.97B | -$3.94B |
| ‘gee ee’ | -0.87 | 959.62M | 337.75M | 1.3B | $69.44 | $63.98 | 1.1B | 8/10/2018 | 8/9/2023 | 10.42B | 4.73B | $65.84 | 5.69B | $65.2 | $123.39B | n/a | n/a | n/a |
| ‘gaming cards and CPUs’ | 1.68 | 2.71B | 5.72B | 3.01B | $71.36 | $71.06 | 1.61B | 8/1 | ‘yello trucking’ | -0.79 | 41M | 41.79M | 82.8M | $3.19 | $6.02 | 51.98M | 2/8/2021 | 8/9/2023 |
| 0/2018 | 8/9/2023 | 61.67B | 32.19B | $74.44 | 29.48B | $74.69 | $178.01B | $201.38B | $298.85B | -$97.47B | ||||||||
| ‘big blue retail’ | -0.28 | 764.64M | 240.87M | 1.01B | $126.1 | $133.95 | 2.7B | 8/10/2018 | 8/9/2023 | 6.76B | 3B | $130.67 | 3.76B | $131.84 | $433.76B | n/a | n/a | n/a |
| ‘fancy ecar’ | 2.3 | 7.29B | 11.83B | 4.54B | $121.99 | $145.91 | 3.16B | 8/10/2018 | 8/9/2023 | 111.82B | 59.56B | $132.95 | 52.27B | $136.56 | $766.31B | $969.3B | $1.77T | -$796.39B |
| ‘smile box’ | -0.36 | 3.69B | 2.16B | 5.85B | $121.97 | $122.16 | 10.26B | 8/10/2018 | 8/9/2023 | 57.57B | 26.94B | $124.43 | 30.63B | $124.17 | $1.41T | n/a | n/a | n/a |
| ’em ess eff tee’ | -0.25 | 1.88B | 764.6M | 2.65B | $210.3 | $223.65 | 7.44B | 8/10/2018 | 8/9/2023 | 19.48B | 8.8B | $218.21 | 10.68B | $220.13 | $2.4T | n/a | n/a | n/a |
| ‘ex arr tee’ | 239.18 | 1.47B | 1.5B | 31.72M | $56.04 | $72.13 | 6.15M | 8/10/2018 | 8/9/2023 | 4.18B | 2.83B | $58.24 | 1.36B | $61.01 | $405.84M | $85.67B | $97.07B | -$11.4B |
| ‘towel’ | 12.12 | 1.1B | 1.69B | 586.42M | $8.39 | $12.21 | 90.71M | 8/10/2018 | 5/2/2023 | 15.69B | 8.39B | $7.93 | 7.29B | $8.16 | $6.81M | $8.71B | $82.56M | $8.63B |
| ‘yello trucking’ | -0.79 | 41M | 41.79M | 82.8M | $3.19 | $6.02 | 51.98M | 2/8/2021 | 8/9/2023 | 931.39M | 445.19M | $3.75 | 486.2M | $4.18 | $88.37M | n/a | n/a | n/a |
This is NOT short interest
- As has been pointed out many times, by myself and by others: This is NOT short interest.
- This is an analysis and interpretation of the daily short volume.
- Short interest is very very special and FINRA has special rules for what it is and how it is reported.
- Please, pretty please, short interest is it’s own thing, the analysis in this post is something else.
- https://www.finra.org/filing-reporting/regulatory-filing-systems/short-interest/faq – read this if you feel inclined to label what I’ve done as short interest, because it isn’t
NOT short interest? Then what is it?
This is a short volume artifact (or “indicator”). There is known unreliability due to self-reported nature of the data.
Come with me on a journey of the discovery of electricity. Starting with silk and amber in 600BCE, then frog legs, then electric ticklers, and eventually a connection to magnetism and motors, lights, and batteries. Total time to get there? Just, like 2,400 years… Sometimes the incremental bits have no point, and need to be built upon.
I’m not a TA master-of-the-dark-arts, I am just exploring some of the raw data in a fairly simple way. It seems unlikely that this method would been unexplored. However, if it has been done, it doesn’t seem like it’s widely referenced.
My previous posts explain this artifact and methods used.
My basic summary of the value of GME
- Current Value. GME company value as a ‘normal’ specialized retail company who sells games and gaming products to an established and growing market. Fundamentals, Quarterly numbers, assets, etc.
- Future Value. Shareholder belief, belief in the mission/essense of the company. Is GME more than a video game retailor? Can it be more?
- The Squeeze. Based on 1 and 2, have shorts and market makers oversold the company?
- DRS is a factor that has removed shares from liquidity, a reported ~25% of outstanding have been DRSed and removed from the liquidity pool at the DTC.
- Continued low volume
- Market maker / short hedge fund activities
- When gamers see an exploit or advantage in a game, they lean into it – same as anyone, find a loophole and exploit it. SHFs leaned into their shorts. Retail investors are leaning back.
While I’ve got my soapbox out:
for RC: Seems like GME has a tricky problem. How do you get people to work on a rocketship and stay? From what I can see, you need to hire those who have transcended space and time who ride the rocket for the sheer joy of it.
for LC:

Power to the players. Power to the creators. Please. Help us help you. Help us help ourselves.
Data interpretations
There’s been a bit of a plateau since my last post, the numbers are surprisingly the same, net shorting seems to have evened out a bit, especially with low volume.
Added a few more columns to the table, multiplying share counts and prices to get estimates for outstanding quantities.
$20.38 is the weighted average short open price for the total 13.59B short shares since July 2019. This can be thought of as representing bearish sentinment.
$19.67 is the weighted average long open price for the total 11.19B total long shares since July 2019. This can be thought of as representing bullish sentiment.
13.59B – 11.19B = 2.4B.
2.4B net shares shorted have accumulated on the public feed since July 2019. This is the aggregate “short minus long” for this time period. – this is important, this 2.4B number is NOT short interest – this 2.4B number is simply the accumulated net short volume since July 2019, it is not short interest
NEW
“$1.08B” paper gain for shorts as of close on 8/9/2023
- (2.4B shares TIMES (20.38 – 20.74))
- assuming the $20.38 average short price is valid.
Put another way: every $1 dollar in price below/above $20.38 is $2.4B in gain/loss/liability. $10 up to $30.38? $24B loss. $15 more to bring us to $45.38 (battle for $180 territory)? $25 * 2.4B = $60B loss. Peak squeeze at ~$483? 483/4 = 120, 120-20.38 = $99.62. $99.62 * 2.4 = $239B loss.
Based on this analysis, this ($1.08B) is the total potential gain/loss/liability shorts were sitting on when the price closed Wednesday 8/9 at $19.93.
“-$869.17M” (2.4B shares TIMES (20.38 – 19.93)) Based on this analysis, this ($869.17M) is the total potential gain/loss/liability shorts were sitting on when the price closed Tuesday 8/8 at $20.74.
Sold, not yet purchased
Shares sold but not yet purchased, at fair market value.
What does that even mean? It means market makers can sell shares that don’t exist to provide liquidity. The idea is that they will then buy them back at a similar price at which they sold them, when they are able. Naked short selling by market makers isn’t illegal.
it may take a market maker considerable time to purchase or arrange to borrow the security…
TLDR
$20.38 weighted average short open price for the total 13.59B short shares since July 2019. This can be thought of as representing bearish sentinment.
$19.67 is the weighted average long open price for the total 11.19B total long shares since July 2019. This can be thought of as representing bullish sentiment.
2.4B net shares shorted have accumulated on the public feed since July 2019. This is the aggregate “short minus long” for this time period.
wut
Price can’t rise, because margin.
Shorts can’t close because price rises when buying.
Shorts never closed. Still probably can’t. Wut du?
Swap ’em and lock ’em. Then hide the key for 50 years?