From: https://www.nasdaq.com/articles/have-spreads-changed-over-time-2021-10-14
As markets started to automate just over 20 years ago, investors saw huge reductions in spread costs, leading to a pickup in liquidity.
But over the last decade, improvements in liquidity and spreads have been slower. In fact, a quick look at spreads over time, adjusted for volatility, shows that spreads might actually be widening.
Automation and decimalization compressed spreads
Starting in the late 1990s, trading began to change very quickly as computerized trading and automation took hold in U.S. markets. Rule changes during that time, including decimalization of quotes, helped lead to much tighter spreads (blue line in Chart 1).
Cheaper spreads, in turn, made new forms of arbitrage and shorter-term trades more profitable to do, boosting liquidity (grey bars in Chart 1).
Chart 1: As automation started, spreads dropped quickly
Most academic research indicates that computerized trading has also improved price discovery and market efficiency.
Over the past 10 years, computers have continued to improve, making markets much faster and arguably pricing even more efficient. However, spreads, trade sizes and liquidity have not changed nearly as much (tail of blue line in Chart 1). Data also suggests that if it weren’t for the recent growth in retail trading, volumes might not have changed materially either.
Has spread improvement stalled?
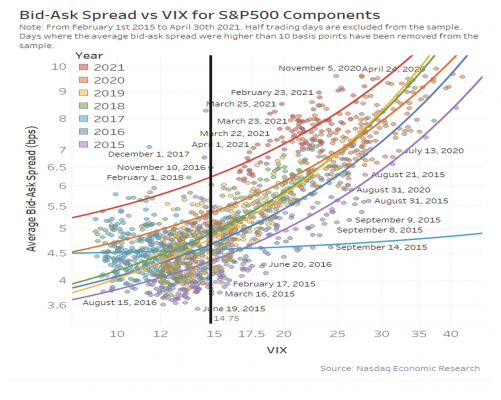
One of the difficulties looking at how spreads have changed over the past decade is the fact that changes in spreads nowadays are mostly driven by market volatility. That fact is shown by the diagonal nature of the dots in Chart 2, which shows that a doubling in volatility leads to around a 50% increase in spreads. That explains most of the shifts in average spreads in recent years (blue line in Chart 1).
The data in Chart 2 shows much more though:
By tracking average large-cap spreads every day (vertical axis) against implied volatility measured by the VIX index (horizontal axis), we see that an increase in volatility generally causes spreads to increase too.
However, we also color the dots by year. That shows that some years are more volatile (2020 orange) than others 2015 (violet). Not surprisingly, spreads in 2020 were also much wider than in 2015.
Adding annual trend lines to the data shows that the linear relationship is roughly parallel (with the exception of 2016, which was a year of very low volatility). That seems to indicate that spreads fall into somewhat different regimes, where one year is consistently different from other years, even if volatility impacts the average spreads more than it impacts the distance between the trendlines.
We then draw the black line at the long-term average VIX, just under 15 for this period. Note that the years are colored in a rainbow scale, with red as the most recent. Remembering that the order for the colors of the rainbow is “ROYGBIV," we see the trend lines intersect the black line is mostly increasing order over time.
Chart 2: Plotting large-cap spreads and volatility trends over time
What about spreads for small-cap stocks?
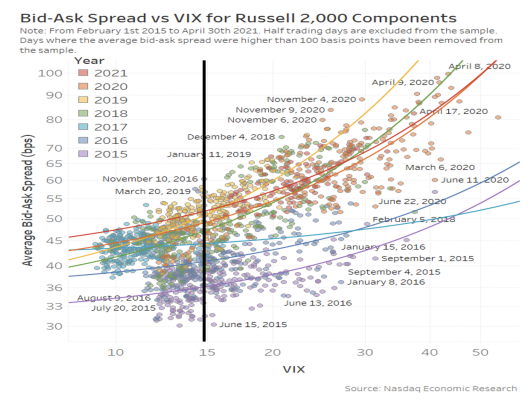
If we do the same thing for small caps, the result is a little different.
Spreads are still increasing over time, but where the trend lines cross, the vertical average shows a “jump” in the first four years that has since stabilized.
Chart 3: Plotting small-cap spreads and volatility trends over time
However, because small-cap stocks have much wider spreads, the increase is also larger, from around 36 basis points (bps) to over 50bps, representing around a 50% increase on a volatility-adjusted basis.
Interestingly, the slope of the trend lines also seems flatter – indicating that small-cap stocks react less to volatility spikes on a relative basis.
Why is this important?
A tight spread created by a competitive NBBO is important for all investors – even those trading off-exchange.
As computers engineer markets to be increasingly efficient, it’s important that the NBBO remains a competitive and efficient benchmark too. So this is a good time to say, again, we think it’s important to reward any trader providing lit quotes on exchange.
Eugenio Piazza, Research Specialist for Economic and Statistical Research at Nasdaq, contributed to this article.