Unwinding the 2020 U.S. Death Counts
by Colin Stayton
May 24, 2021
This short paper will be fun for any of you who enjoy exercises in logic. Letâs start with this Wall
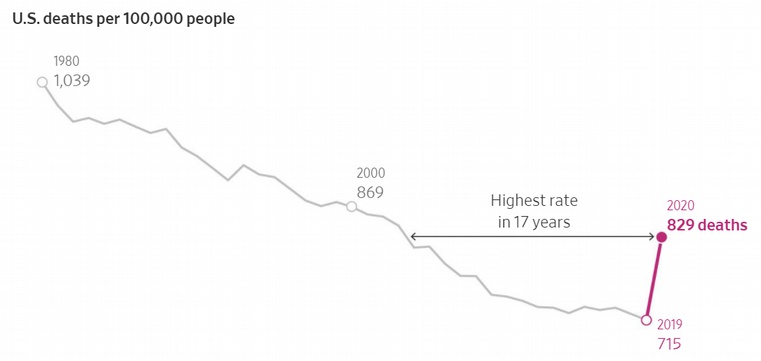
Street Journal article published May 20: âCovid-19 Disrupts Years of Health Progress in U.S.â
There the authors tell us last yearâs U.S. death rate hit the highest level seen in nearly two
decades. Right away we notice several things amiss with this article, beginning with the title.
Since when were we making progress in the area of health? Rates of chronic illnesses such as
heart disease, diabetes, cancer, autism, and Alzheimerâs have been steadily climbing for decades,
not to mention anxiety, depression, and suicide. Itâs clear from the outset the authors are
defining health purely in terms of mortality rate. Even then theyâre still wrong, as the U.S. death
rate has been increasing about 1.6% annually due to population aging. So as a population weâve
been getting older and sicker and less interested in starting families, which is a good indication
of just how unhealthy we are, not just medically but societally. The authors also point out that
life expectancy has declined for the first time in decades, but again, this is a completely useless
metric for gauging health. In our case, all it means is that weâre able to keep sick people alive
longer using artificial means, which themselves create more sickness.
And, as we are about to see, precisely none of their new data is true, so the whole thing is a wash,
as usual.
The most obvious problem with the article is that it never gives you the raw figures. It never tells
you how many people actually died last year in absolute terms compared to previous years.
Doesnât that strike you as odd? They only give you the age-adjusted death rate â the number of
deaths per 100,000 people after âadjusting for ageâ (whatever data magic that entails). As youâll
see in a moment, the reason they never give you the raw death count is because the numbers
make no sense. But even just looking at the percentage rate, you can start to see whatâs going on:
It looks dramatic, but even if we accept the numbers as true (they are not), in the grand scheme
of things itâs actually quite tame. We reverted back to 2003 levels of mortality. Big whoop. Think
back to 2003: were people dying left and right? Was the media constantly buzzing about how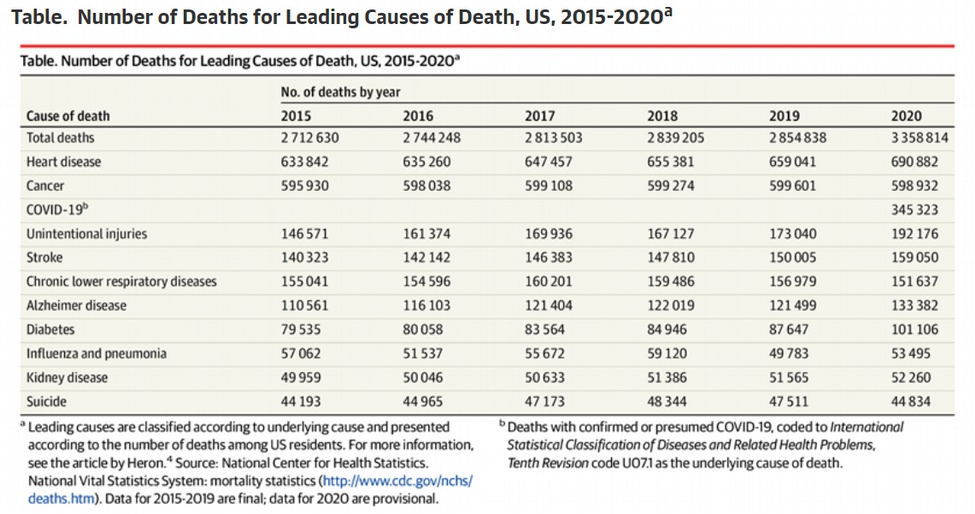
horrible the mortality rate was? Was there some nasty epidemic wiping out our population? Of
course not. The difference between 2003 and 2019, when the death rate was down at 715, is
simply that more and more aging adults went on Medicare and Medicaid, programs that are
designed to keep you alive for as long as possible, no matter the cost. Our modern geriatric care
system has been masking the true state of health of our aging population for decades now. As I
said, we are keeping our elderly alive longer through artificial means, not by keeping them
healthy and happy. We simply have a lot more sick and miserable old people than weâve ever
had.
By one reading, that would mean 2020 was a partial correction. Thanks to the lockdowns and
dystopian social measures, lots of elderly people (and younger people) simply gave up. Their
spirits were broken down, so their bodies broke down. In some cases they stopped accessing
medical care and therefore stopped accessing the artificial means by which they were being kept
alive. In other cases, being plunged into a strange and miserable new world of isolation and
facelessness, they lost the will to live and their diseases inevitably took over. So the death rate
saw a partial correction closer to the true level we would have if we stopped artificially extending
life and just let nature take its course. And remember, we saw exactly that in Cuomo's crisis in
New York, with the system letting thousands of old people die that would normally not die.
If we look at the raw death counts, we see thatâs basically what happened:
First notice that data for 2020 is provisional. What does that mean? Who knows, but I assume
it means no one has yet checked it as we are doing, to show it is fudged in major ways.
Regardless, this table is helpful because it shows you the raw data over the last six years for
comparison. I did a simple comparative analysis to determine what the expected numbers would
be for each major cause of death had Covid never happened and 2020 had simply followed the
trend of the previous five years. Hereâs my spreadsheet if you care to see it. We find several
anomalies:
ï·
Heart disease deaths were 3.85 percentage points above expected (492% or ~5x
higher)
ï·
Unintentional injury deaths were 6.74 percentage points above expected (256% or
~2.5x higher)
ï·
Stroke deaths were 4.34 percentage points above expected (358% or ~3.5x higher)
ï·
Chronic lower respiratory deaths were 3.73 percentage points below expected (1,030%
or ~10x lower)
ï·
Alzheimer deaths were 7.37 percentage points above expected (406% or ~4x higher)
ï·
Diabetes deaths were 15.36 percentage points above expected (622% or ~6x higher)
ï·
Suicides were 7.49 percentage points below expected (504% or ~5x lower)
ï·
Deaths from all other causes were 8.20 percentage points above expected (504% or ~5x
higher)
ï·
In total, there were approximately 120,000 excess deaths not due to Covid
These arenât just minor anomalies, but incredible swings from the trendline. Whatâs going on
here? Can you unwind the riddle? Letâs start with the fact that chronic lower respiratory disease
deaths were 10x lower than expected. We know that doctors were given free license to report
pretty much anything and everything as a Covid death, even without a positive diagnosis. So we
expect to see them robbing Peter to pay Paul. But surprisingly, we see the opposite with
flu/pneumonia, the rates of which according to this data (but no other data) remained within
the typical range. This is bizarre because, as youâll recall â and as the CDCâs own reporting
admitted â flu cases essentially disappeared the moment Covid hit the scene in March and they
remained near zero for the rest of the year. Now weâre being told flu and pneumonia deaths were
just as high as previous years. How does that make sense? It doesnât, and it just shows that the
more lies they tell, the harder it is for them to keep their lies straight.
Just to be sure you got it, we have caught them in a major fudge. This is the primary smoking
gun here. They needed to get that total death count way up, to support the Covid script, so they
added in the old expected flu and pneumonia numbers, instead of the actual numbers. Basically
they are counting the same deaths twice: once as Covid and once as old flu/pneumonia. This
bumps the total way up. So the number 3,358,814 is massively inflated, just as we expected.
Youâll say itâs because the majority of flu cases occur in the first few months of the year, so we
wonât see the effects of the fluâs disappearance until this yearâs numbers are published. But
hereâs a Time.com article from the first week of January 2020 stating that 2,900 flu deaths had
occurred so far that flu season. Since the total â19-â20 flu season deaths were allegedly 22,000,
that means 13% of deaths occurred at the back end of 2019. Which means the 2020 flu deaths
should be about 13% lower than normal, since there were virtually zero flu cases this past fall.
But instead there was a 7.46% uptick. As usual, none of it adds up.
And if we assume that flu and pneumonia deaths did in fact remain steady year-on-year, do you
know what that means? It means all the lockdowns, social distancing, and masking were
completely ineffective. If all those things were supposed to prevent the transmission of Covid,
they would also prevent the transmission of other infectious diseases, so we would expect flu
and pneumonia deaths to have declined significantly. Instead, they stayed the same. That means
Covid deaths would have remained the same with or without those measures, as well. Of course,
MIT researchers are now allowed to admit this, now that those measures are being lifted.
Another riddle to be unwound is that suicides allegedly landed 5x below expectation. The
expected amount is misleading, since in a year of rapid social change, fear, isolation, and job
loss, you would expect suicides to spike at least 10-15%, and probably a lot more. Instead, they
dropped noticeably. Again, this makes no sense, since it is admitted that mental health problems
did spike in 2020. For example, depression rates tripled. Suicides should have followed a similar
trend. I contend that they did, but itâs being hidden in the data. See here, where itâs admitted
that many likely suicides from drug overdoses are tallied as unintentional injuries, since for one
reason or another the intent to self-harm canât be proven (i.e., they didnât leave a suicide note).
And, what do you know, drug overdose deaths spiked during Covid. That explains why
unintentional injury deaths saw a 2.5x increase. Whether these people intended to kill
themselves or just needed âa little moreâ to cope with the manufactured hellscape of 2020, the
fact remains that the elites running the Covid show are directly responsible for these deaths.
Weâll get back to that.
The real story here is the unprecedented rise in deaths from diseases like heart disease, stroke,
diabetes, and Alzheimerâs. It confirms what I said at the start, that many older people simply
gave up the will to live in 2020, and their diseases took over. The media is spinning this as lack
of healthcare access because the medical system was overloaded with Covid patients, but we
now know from #filmyourhospital that this simply wasnât the case, even in alleged hotspots like
New York City. We are also told a lot of people were afraid to go to a hospital because of Covid,
which may be partly true, but most of these deaths occurred in nursing homes, where the
protocol is to phone an ambulance for a mosquito bite. These elderly folks in nursing homes
were still getting their vitals and blood sugar levels monitored all the time, so the story doesnât
really check out. The more plausible explanation is just what Iâve told you: their spirits gave up,
so their bodies gave up. After a certain point, no amount of medical intervention can reverse it,
because itâs primarily a spiritual process, not a physical one.
And that's only one possibility. The other possibility is that these numbers were also fudged
higher to get the total number up.
In case you havenât figured it out yet, this is the key to solving the riddle. Take the largest %
increase on the board, which is diabetes deaths at 15.36%. Why would diabetes death increase
that much but deaths from other leading illnesses wouldnât? Like cancer deaths, which we are
supposed to believe actually decreased slightly, or kidney disease deaths, which remained flat.
Thereâs no logical explanation for this. Itâs clear that these non-Covid deaths are being
suppressed by being recoded as Covid deaths. In fact, if you just apply the increase in diabetes
deaths (15.36%) to all other causes, you pretty much account for all excess deaths last year.
So, did Covid really kill 345,000 Americans last year? No, but the Covid show probably killed
many. Which brings me to my earlier point: the Gates, Faucis, and Newsoms of the world are
directly responsible for all of those excess deaths. Or you could believe that the Covid deaths
were just made up, in which case there were only 120,000 true excess deaths. Fine, then these
snakes are responsible for 120,000 deaths. Last time I checked, that still passes the threshold
for genocide. So we have all been witness to a genocide in our own country, perpetrated by our
own government and the international financiers behind it â and the entire world is
turning a blind eye. We have just had the Holocaust of the twenty-first century, and will
continue to have it as more and more people drop dead from the vaccine, and now instead of a
few rogue Holocaust deniers, you and I are the few brave Holocaust affirmers. This is the
upside-down world we now live in.
Miles: for myself, I choose scenario twoâthese numbers were just made up, so we don't really
have to explain them logically in any way. Colin showed they were counter to logic, trend, and
prior data, so there is no reason to accept them at all. One thing he didn't hit is that accidents
(unintentional injuries) should have gone way down, and in prior reports they did. Car accidents
should have dropped noticeably, for example, since far fewer cars were on the roads. Work
accidents should have dropped by huge amounts for the same reason. Murders should have
dropped because people weren't seeing one another. But of course they made up and continue
to make up a lot of fake murders to use as part of their propaganda blitzes. If they can make up
those murders, they can fake all these other numbers as well. Data that makes no sense should
just be ignored. We don't need to explain it, except as more obvious disinformation.