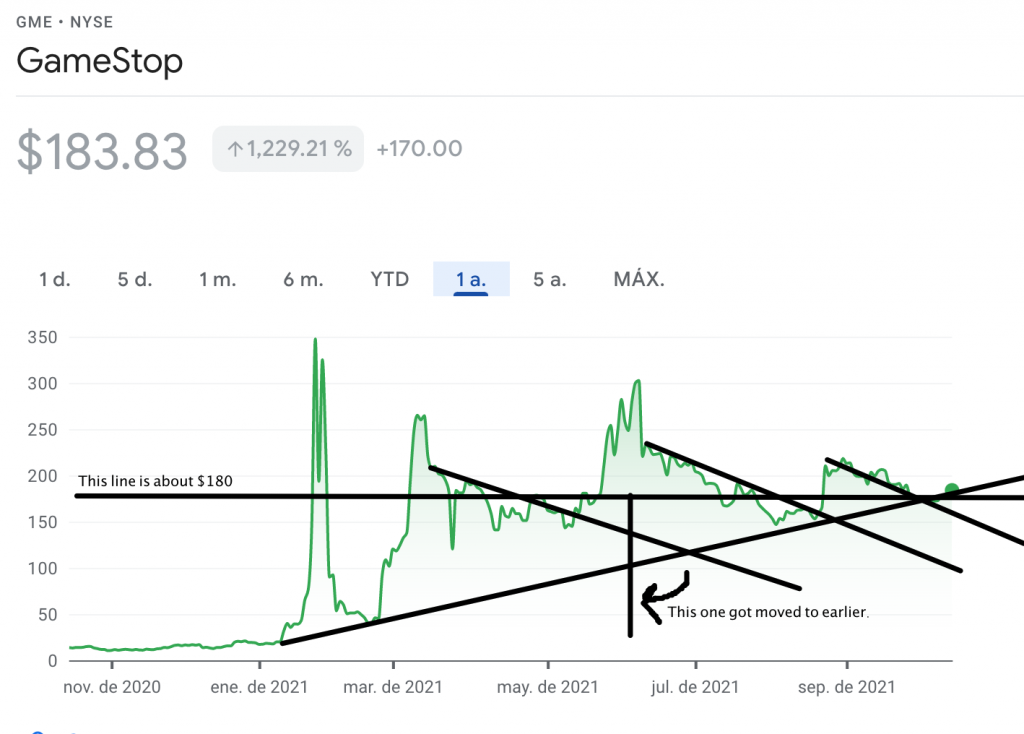
Price action cycles are clearly visible. A cycle is a run-up and a subsequent hammer-down. Strange how hammer-downs have the same slope more or less?
I’m drawing all of these by hand and inexactly. The point is, all of these analysis are approximate. Also, I don’t concern myself with the highs too much, but definitely with the lows.
I feel that one of the cycles was moved up to coincide with the earnings date. In June, the hammer-down after earnings was brutal. I think more than one mechanisms was at play.
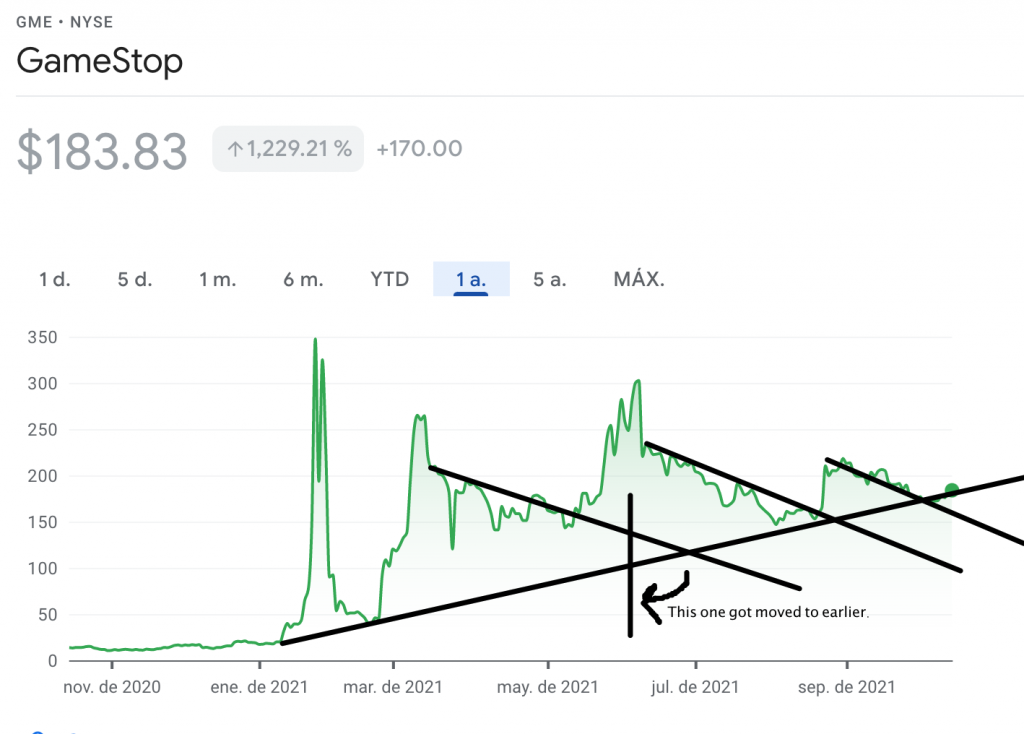
According to this, today (mid-october 2021) we should see a run-up. The price climbed above 180, but is already trending down. Maybe this was a tiny little spike, or maybe we’ll see something late on Tuesday.
I also drew the $180 line. I believe Marge calls when the price moves above this line. Maybe it’s only my confirmation bias that it happened just yesterday, maybe there is a different mechanism countering this now, or maybe I’m completely off on this. But previously, the price has been pegged at 180 several times, and it feels like they want to drive the price down below 180.
If I had to attempt to predict the future, I’d draw it like this. It’ll dip below 180 again and again. It’ll rise above 180 again and again. The cycles will continue until they cannot continue. RDS is a very powerful force, it seems, that may stop it – but when, which month? Noone knows. I’m not too optimistic about either NFT dividend or DRS. I don’t think anything will happen this year, so we have another 3 months to work with.
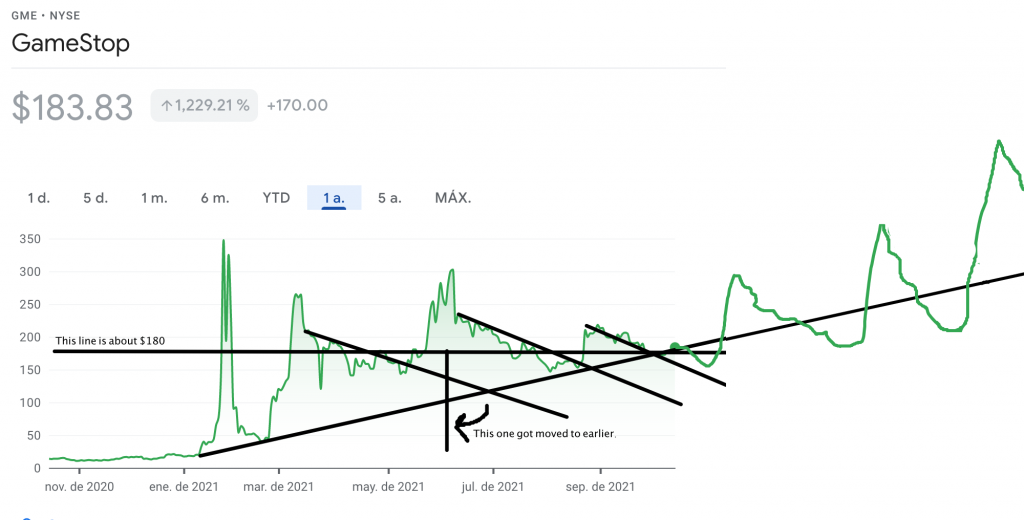
Also, Ryan Cohen cannot speak for Gamestop until March 2022. We should see crazy price action in March : )
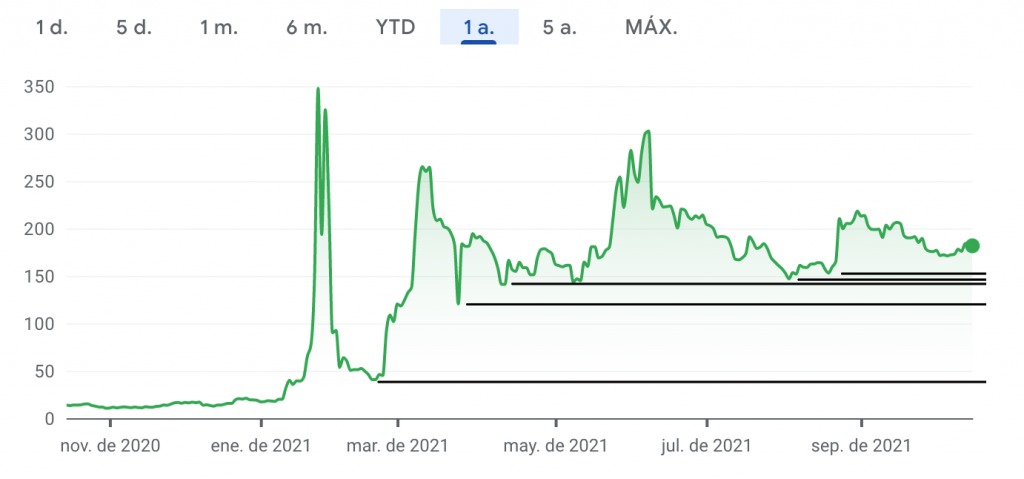
Finally, I’d like to remind everyone that the lows are getting higher. The short sellers should be unable to hold their position, if the price stays above 180 long enough. This is all quite exciting.