Adverse Events after COVID Jab: This Ain't No Ordinary Vaccine!
Read this article in: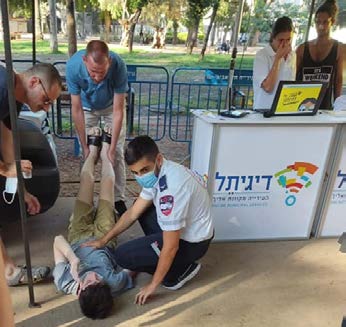
Adverse Events after COVID Jab:
This Ainât No Ordinary Vaccine!
Above: a boy in Tel Aviv fainted immediately after his COVID-19 vaccination.
There has been a dramatic increase in the number of reports submitted to the CDC's Vaccine
Adverse Events Reporting System (VAERS) fol owing the rol out of COVID-19 vaccines. For
example, as of June 18, reports of deaths fol owing COVID-19 vaccines represented 50% of al
deaths ever reported to VAERS since 1991.
This report presents data and analysis to respond to two questions about this increase:
1. Is the increase in reports due to the increase in the number of vaccinations?
2. Is the increase in reports due to what is known as âstimulated reporting,â meaning that
people are reporting more due to increased awareness of the existence of VAERS and/or
increased fear surrounding the COVID-19 vaccines due to media exposure. etc.
I begin with a brief background on VAERS and present data on the number of adverse events
that have been submitted to VAERS fol owing COVID-19 vaccinations. I then respond to the two
questions above.
The Vaccine Adverse Events Reporting System (VAERS) was created for medical staff and
individuals to report adverse events that occur fol owing vaccination. It is run by the FDA and
CDC. An adverse event is any medical problem associated with use of a drug or treatment, or in
this case a vaccine. An adverse event that occurs after vaccination does not necessarily mean
that the treatment caused the event, and reported events are not assumed to be causal y
related to the vaccination. According to the CDC, the system is designed to detect safety signals
that might be related to the vaccine, which can then be studied with more appropriate data and
methods.
1
One of the main weaknesses of VAERS is undercounting: reporting is passive and voluntary,
which means that most adverse events that occur wil not be reported. The question is, to what
extent are adverse events following COVID-19 vaccinations undercounted?
One answer to that question comes from a study published in JAMA conducted on employees of
Massachusetts General Brigham Hospital who were surveyed about anaphylactic reactions
following their vaccinations (Blumenthal et al. 2021). The paper focused on anaphylactic
reactions (anaphylaxis is a severe allergic reaction that can cause death), because it is one of the
known and widely acknowledged reactions to COVID-19 vaccines. They found a rate of 2.5 such
reactions per 10,000 vaccinations. We can compare that to the CDCâs estimate of anaphylaxis
reactions based on VAERS data, which is .02 to .05 per 10,000 vaccinations. If the true rate is
closer to 2.5 per 10,000 as in the JAMA article, this means that only between 0.8% to 2% of all
reactions are reported to VAERs. Or another way to say that is that the true rate of anaphylaxis
reactions in the population is 50 to 125 times the number reported to VAERS.
And there are good reasons to expect a much higher rate of reporting for anaphylactic reactions
compared to other types of events, and not just because anaphylaxis is recognized as a side
effect of COVID-19 vaccinations, whereas most other reactions, especially serious ones, are not.
One reason is that people are supposed to stay under observation in the location where they
were vaccinated for 15-30 minutes afterwards, which is when the vast majority of anaphylactic
reactions occur. Since most people should be under medical supervision if they experience
anaphylaxis, and since healthcare workers are mandated to report anaphylaxis cases following
COVID-19 vaccinations, it is likely that other types of reactions are undercounted even more.
Below, Table 1 shows the number of different types of adverse events that appeared in the
VAERS data released as of June 18 of reports from non-foreign sources. It corrects for
undercounting by showing how many cases there would be if one multiplied the number of
events by 50 and 125 times, as indicated by the JAMA study on anaphylaxis. In the table, âtotal
casesâ refers to the number of people who submitted a report. âTotal adverse eventsâ refers to
the total number of events those people reported, which is much larger than the total cases
since one person can report more than one medical problem. âSerious adverse eventsâ include
anything that: required hospitalization, was life threatening, led to permanent disability or
substantial disruption of oneâs ability to function normally, a congenital problem, or death.
Table 1:
Adverse Events Reported to VAERS
Total
x50
x125
Total Cases
38
4,270 19
,213,500 48
,033,750
Total Adverse Events
1,
667,140 83,357,000 20
8,392,500
Serious Adverse Events 29
,583 1,
479,150 3,
697,875
Hospitalization
21
,440 1,
072,000 2,
680,000
Life Threatening
6,
299 31
4,950 78
7,375
Permanent Disability
4,
996 24
9,800 62
4,500
Deaths
4,
812 24
0,600 60
1,500
2 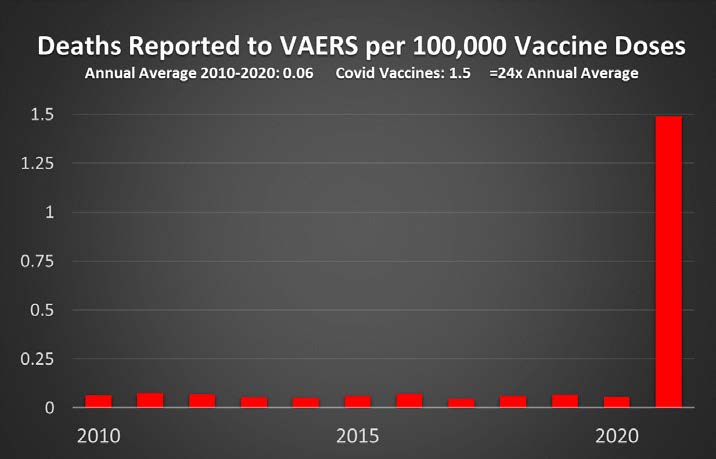
Is The Increase in Reports Due to The Increase in The Number of Vaccinations?
Figure 1 below shows the number of deaths reported to VAERS per 100,000 vaccine doses for
COVID-19 vaccines is 24x the average annual number of deaths per 100,000 vaccine doses
reported for all other vaccines from 2010-2020. This clearly shows that the increase in reporting
is not simply due to the increase in the number of vaccinations. (Methodological notes for this
and the following tables are in the appendix.)
Figure 1
Is The Increase Due âStimulated Reportingâ?
The tables below respond to the second question regarding stimulated reporting. The
CDC uses VAERS as a way of detecting potential safety signal with vaccines. If they
detect a signal, they can fol ow up with more appropriate data and methods to
investigate its connection to the vaccine. The main way they detect safety signals using
VAERS is to compare âthe proportion of reports involving a specific adverse event and a
specific vaccine can be compared to the proportion of reports involving the same
adverse event and other vaccinesâ (Shimabukuro et al. 2015:6). This is also the method
the CDC uses to determine if an increase in adverse events is due to stimulated
reporting.
A paper by researchers at the CDC (Velozzi et al. 2010) investigated stimulated reporting
in the context of the H1N1 Swine Flu vaccine introduced in 2009, fol owing which there
was an increase in reporting to VAERS that was 2 to 3 times greater than for seasonal
influenza vaccines per million vaccinations. However, they concluded that this was due
to stimulated reporting since the overall proportion of adverse events reported in
different categories for the H1N1 vaccine was for the most part similar to the proportion
reported for seasonal influenza vaccines.
3
I adopted the approach used by Velozzi et al. 2010 to compare reporting rates for
categories of adverse events between COVID-19 vaccines and seasonal influenza
vaccines. Table 2 uses a slightly different methodology than Tables 3 and 4. Data sources
and methodological notes are in the appendix.
Table 2:
Adverse Events Reported to VAERS per Vaccine Dose:
COVID-19 vs. Flu Vaccines
Per 100,000 Doses Relative
COVID-19
Flu
Difference
Serious
9.1
0.3
30x
Not Serious
109
5.8
19x
Death
1.5
0.02
82x
Disability
1.5
0.08
19x
Emergency Room
16
1.1
14x
Hospitalized
6.6
0.22
30x
Life Threatening
1.9
0.06
31x
Blood Clot Related Events
0.3
0.04
7x
Myocardial Infarction
0.7
0.06
12x
Note: Adverse events and doses for flu vaccines based on 2016, 2017 & 2018 flu seasons.
Analysis Stratified by Age
A direct comparison between flu and COVID-19 vaccines does not take into account the fact that
the age distribution of people inoculated against flu is very different than the age distribution of
people who have been inoculated against COVID-19. Tables 3 and 4 below compare adverse
event reports by age group. Table 3 shows the relative difference (ratio) of the COVID-19
adverse event reporting rate per 100,000 doses to the reporting rate for flu vaccinations per
100,000 doses (as an average of the reporting rate across the 2015-2019 flu seasons). Table 4
shows the proportion of all adverse event reports (cases) that included serious events and
deaths, comparing COVID-19 vaccines versus flu vaccines (again as an average of the 2015-2019
flu seasons). For both of these tables, the estimates for flu vaccines represent the average
reporting to VAERS across the 2015-2019 influenza seasons. All differences are statistically
significant using Chi-square tests.
4
Table 3:
COVID-19 vs. Flu Vaccines: Adverse Events Reported per 100,000 Vaccine Doses
ALL EVENTS
SERIOUS EVENTS
DEATHS
Relative
Relative
Relative
Ages
COVID-19
Flu
Difference COVID-19
Flu
Difference COVID-19
Flu
Difference
Age 10-17
92.77
3.10
30x
5.01
0.11
47x
0.09
0.001
84x
Age 18-49
140.69
4.93
29x
6.05
0.23
27x
0.27
0.004
62x
Age 50-64
122.14
4.36
28x
8.66
0.20
43x
0.93
0.005
197x
Age 65+
99.43
8.62
12x
16.25
0.41
40x
4.17
0.028
149x
All Ages
122.37
5.43
23x
9.48
0.25
38x
1.51
0.010
154x
Note: Flu reporting rates represent the average reporting rate to VAERS across the 2015-2019 flu seasons for each age group. Covid-19 reporting
rates include all reports to VAERS for COVID-19 vaccines for each age group. Annual vaccine doses estimated using data from the CDC and the
US Census Bureau. Relative difference is the ratio of COVID-19 reporting rates to the average flu reporting rate across the 2015-2019 flu seasons.
Table 4:
COVID-19 vs. Flu Vaccines: Proportion of Serious Adverse Events and Deaths
Reports (N)
SERIOUS EVENTS
DEATHS
Proportion
Relative
Proportion
Relative
Ages
COVID-19
Flu
COVID-19
Flu
Difference COVID-19
Flu
Difference
Age 10-17 12,868
519
0.054
0.035
1.5x
0.0010
0.0004
2.8x
Age 18-49 18,2533
2,219
0.043
0.046
0.9x
0.0019
0.0009
2.1x
Age 50-64 98,759
1,789
0.071
0.046
1.6x
0.0076
0.0011
6.8x
Age 65+
84,384
2,816
0.163
0.046
3.4x
0.0419
0.0034
12.5x
All Ages
36,5676
7,342
0.077
0.048
1.6X
0.0123
0.0033
3.71x
Note: Flu estimates represent the average reporting rate to VAERS across the 2015-2019 flu seasons for each age group. Covid-
19 reporting rates include all reports to VAERS for COVID-19 vaccines for each age group. Vaccine doses estimated using CDC
and the US Census data.
The results show two things very clearly: 1) An enormous increase in reports to VAERS from
COVID-19 vaccines compared to seasonal influenza vaccinations, even after controlling for the
number of doses administered; 2) A very different pattern of reporting for influenza and COVID-
19 vaccines. Alarmingly, there are significantly higher rates of reporting of serious adverse
events and deaths after vaccination for COVID-19 than for influenza, both as a function of
vaccination doses and as a function of the number of reports.
Note that the 84:1 figure for deaths among 10-17 years old in Table 3 does not provide the full
picture. Across all five flu seasons there was only 1 death reported among 10-17 year olds
following influenza vaccinations, out of a total of 83,402,513 vaccination doses received by this
group over that period. That is compared to 13 deaths out of 13,870,224 COVID-19 vaccinations
for that age group.
5
METHODOLOGICAL APPENDIX
Table 1
Counts for different types of adverse events were retrieved from CDCâs WONDER interface for
VAERS using the data released as of June 18, 2021. For all tables and figures I only used reports
from non-foreign sources, so the numbers here are probably lower than what youâve seen in
other places.
Figure 1
The number for 2021 includes only the 4,812 deaths reported for COVID-19 vaccines that
appeared in VAERS as of June 18 and excluding reports from foreign countries. The number of
COVID-19 vaccine doses administered in the US was taken from usfacts.org, which reported that
the number of doses of COVID-19 vaccination doses used as of June 27 was 323,327,328.
The figures for 2010-2020 include all deaths that appeared in each year in the VAERS database
from all vaccines, excluding reports from foreign countries. The number of vaccine doses
administered is based on flu vaccination doses distributed each year in the US (from CDC data
here) and an estimate of the number of childhood vaccine doses administered each year.
That number was calculated as follows: children of a particular age X number of vaccine doses
on the CDC schedule for that age X .9 assuming a 90% vaccination rate. Notes on these figures:
ï´ Children of a particular age was based on the number of children born in 2017: 3.85
million (the birth rate has been declining for over a decade so the number was a bit
larger in earlier years, so this method of estimation is conservative and will tend to
underestimate the number of vaccinations, producing a lower estimated death
reporting rate).
ï´ Number of vaccine doses (not including influenza) on the CDC schedule: 1st year of life:
16; Second year: 8; 4-6 year olds: 4
ï´ A 90% vaccination coverage rate (which is lower than what the CDC says the coverage
rate is, so again this method of estimation is conservative).
ï´ Assuming the same number of children in each age category based on 2017 birth cohort
(3.85 million), we would expect over 100 million childhood vaccinations/year:
ï´ 16*3.85million + 8*3.85million + 4*3.85million = 107 million but the figure used
is 100,000 (again to be conservative)
ï´ Plus flu vaccination for each year (average over this period was 153.2 million)
ï´ This number does not take into account teenagers who now routinely get TDAP and HPV
vaccinations, as well as adults who get other vaccinations beside influenza. So it is once
again a conservative estimate. In any case, the number of vaccinations is so large
relative to the number of reported deaths that changes of tens of millions in any
direction has little effect on the estimates of deaths per vaccine dose.
6
Table 2
Table 2 shows the number of several different categories of adverse events per 100,000 vaccine
doses that appeared in VAERS per 100,000 vaccine doses as of June 18; it compares COVID-19
vaccines to influenza vaccinations from the 2016, 2017 and 2018 flu seasons combined.
The numbers for COVID vaccines includes all reports that appeared in VAERS as of June 18 and
excludes reports from foreign countries. The number of COVID-19 vaccine doses administered in
the US was taken from usfacts.org, which reported that the number of doses of COVID-19
vaccination doses used as of June 27 was 323,327,328.
To select a comparable sample of influenza vaccination adverse event reports, I examined
reports submitted to VAERS for all influenza vaccines that appeared in the system for the 6-
month period from September through February, which is the flu season when most people get
vaccinated for flu. I chose a 6-month period to match with the 6+ months since COVID-19
vaccines first became available until June 18.
I included all reports that appeared in VAERS from Sept. â Feb. for three of the most recent
influenza seasons 2016-2017, 2017-2018 and 2018-2019. I did not include 2019-2020 because I
did not want the data to be contaminated in some way with the appearance of COVID-19. I
combined all those reports for my comparison. The number of flu vaccinations was estimated at
160 million/year. According to CDC data, the average number of doses distributed over these
three seasons was 157 million.
Although a different or longer time period could have been chosen, the smal number of reports
in comparison to the very large number of inoculations renders even relatively large differences
in the numerator or denominator virtually meaningless.
The number of blood clots reported was calculated by cross-reference adverse events (at the
âpreferred termâ level) with the Standardized MedDRA Query (SMQ) code âembolic and
thrombotic events,â which produced a list of 294 associated AEâs that are definitely or probably
related to blood clots (or technically, embolisms or thromboses).
I then calculated how many VAERS reports matching any of those 294 categories appeared in for
the relevant vaccine types in the relevant time periods. For influenza vaccines across all 3
seasons, there was a total of 26 different types of adverse events. For COVID-19 vaccines, there
was a total of 80 different types of adverse events.
Tables 3 & 4
These two tables were calculated using the fol owing data and procedures:
Data on the population in each age group and year was calculated from the US Census Bureauâs
American Community Survey in Census Table S0101 based on 1-year estimates for each year.1
1 Due to incompatibility across al the datasets in age categories, I was not able to restrict the teen
population categories to ages 12-17, which is the youngest age group for which COVID-19 vaccinations are
7
Data on the total number of flu vaccinations distributed annually comes from CDC estimates.
Data on proportion in each age group vaccinated against influenza in each year comes from CDC
FluVaxView data compiled here. Data on number of COVID-19 vaccine doses given in each age
group as of June 30,2021 comes from usfacts.org.
Data on adverse events for each age group for COVID-19 and all influenza vaccines were
col ected from VAERS data updated as of June 25, 2021. For COVID-19, I counted all adverse
events that had been submitted to and processed by VAERS excluding reports from foreign
countries.
For influenza vaccines, I followed Velozzi et al. 2010 and restricted reports in each season to
reports submitted from July 1 â March 31 in the following year2 where vaccination date was
reported between July 1 â January 31 in the following year. The calculations below were done
for 5 influenza seasons beginning with the 2015-2016 season through the 2019-2020 season.
The rates reported in the tables represent the average across all 5 seasons.
Calculation Procedures: I estimated the number of people in each age group for each year by
multiplying the total population by the proportion in each age group.
ï´ Total population per age group = Proportion in age group*Total population
In order to estimate the number of people in each age group who received an influenza
vaccination, I multiplied the number of people in each age group by the proportion estimated to
have received influenza vaccination in each age group in each year.
ï´ Number of influenza vaccine doses per age group = Proportion inoculated for each
group*Population in each age group
To estimate rates of adverse events per 100,000 doses, I divided the number of adverse events
by the number of doses received for each age group and multiplied the result by 100,000.
ï´ Rate of adverse events per 100,000 doses for each age group = (Number of adverse
events for age group/number of doses received for age group)*100,000
To estimate the rates of serious adverse events and deaths per report (case), I divided the
number of adverse events or deaths by the number of reports received for each age group.
ï´ Proportion of serious adverse events and deaths = Number of adverse events or deaths
/ the number reports each age group
For flu vaccines, the table represents the average reporting rates of adverse events across all 5
flu seasons (2015-2019).
To estimate the relative differences (ratio), I divided the reporting rate for COVID-19 vaccines by
the average reporting rate for flu vaccines from all 5 seasons for each age group.
currently recommended. Therefore, the adverse events data, population and flu vaccine doses include 10-
17 year-olds, but the COVID-19 vaccination doses represents 12-17 year-olds. There were 0 serious or
death reports for COVID-19 vaccines in VAERS for 10-11 year olds, and only a few hundred non-serious
reports for 10-11 year olds.
2 Velozzi et al. 2010 use a cut-off of reports received by March 15th, but I was only able to restrict the date
to March 31st using the on-line VAERS data extraction portal at https://wonder.cdc.gov/vaers.html.
8
ï´ Relative differences = COVID-19 reporting rates for each age group / Average reporting
rate across all flu seasons for each age group
9