Somewhat related to the most recent US elections, I’ve been researching the whole “white working class” situation, and one strange anomaly has popped up.
When one looks at a graph of productivity (for the US) vs real wages, there is a marked “disturbance in the force” around 1974.
(11/18/18 note: A nearly identical graph appears in Scientific American, Nov 2018, p 61, in an article titled “A Rigged Economy”.)
Is there any agreement among economists as to what caused wage growth to plateau like this?
Update:
I studied the article that luchonacho suggested, by Bivens & Mishel (2015), and found it interesting, but it didn’t directly address my question. The article was basically a justification for the numbers presented in the above graph and similar presentations, in particular arguing against skeptics that the productivity numbers were real — that productivity hadn’t leveled off with wages. I’m not able to evaluate these arguments to any significant degree, but at least on the face of it their justification seems sound.
However, that article pointed me to an earlier article by Bivens, et al (2014) which does attempt to identify the factors that caused the change of trajectory of productivity. I’m still evaluating this article, but it can be noted that:
- This was during the Nixon administration
- This was during a period of fairly serious “stagflation”
- Nixon ordered his wage/price freeze in August of 1971
- The Arab oil embargo began in 1973
- The US went off the gold standard in 1971
- The US trade balance went negative in 1972 and has remained mostly negative ever since
- Union membership, which had been declining since the 50s, began a steeper slide in the 70s
- OSHA was founded in 1971
- And, of course, the CEO-to-worker compensation ratio climbed slowly but steadily through the 70s (after being relatively flat for the entire postwar period), then accelerated rapidly in the late 80s
Which of these factors (or several other ones too “minor” to mention here) is relevant to my question is hard to guess at this point. The issue is confused by the fact that, though the “knee” in the curve appears to be 1973, that was a period of significant economic turmoil (probably the worst since WWII and before the Bush-era difficulties), so it’s not unexpected that the lines would “jiggle” a bit, and thus it’s hard to place a date on the actual change of the nature of the economy that caused this phenomenon.
I will continue investigating, and I would appreciate any (constructive 😉 ) input.
Further update:
Finished a first review of the Bivens (2014) article, and it didn’t have anything real solid to offer. Several contributing factors were mentioned, but most didn’t kick in until the 80s, or later, and the general drift of the article was to propose “fixes” to current conditions rather than explain the triggers that caused the phenomenon in the first place. The one factor that might have applied early is private sector union membership, as it took a nose-dive in the early 70s. (This was made up, in part, by a rise in public sector membership.) And some argument can be made that tax policies had some part in things, though the evidence for this is weak.
However, while reviewing the article I went off on a few tangents, exploring statistics that the article did not directly address. I (a bit to my surprise) found some seeming correlations between the “real wage” fall off and the growth of money supply, the negative balance of payments, and the rise in national debt, all of which changed course in the early 70s, resulting in permanent deviations from historical patterns.
It seems strange to me that this apparent correlation is not (so far as I know) widely discussed, as one would think that “budget hawks” would zero in on any apparent connection between these factors and wage levels. (Of course, they might not have noticed, as the same factors appear to be making CEOs quite wealthy.)
One thing I haven’t found, but which I suspect, is that some changes in the rules for corporate governance may have been a factor.
Still searching.
Tentative conclusion:
In 1971 President Nixon supposedly said “I am now a Keynesian in economics”, after Milton Friedman had previously stated “We are all Keynesians now”. The main issue at play here was the idea of intentionally running a federal budget deficit to “spur” the economy.
There is no single event to point to, but over about 10 years, from 1970 to 1980 tax rates were lowered significantly for some segments of the population — basically the 1%ers and corporations, and large amounts of Treasury bonds were issued to make up the resulting deficits. (Prior to Nixon’s pronouncement Republicans, in particular, were deficit hawks, but the change in viewpoint gave them “permission” to lower taxes without cutting spending, and similarly allowed Democrats to raise spending without raising taxes.)
The result is that the federal budget has been (with the exception of 1998-2001) running (ever increasing) deficits.

And, close as my Ouija board can decipher, this has the effect of drawing in a lot of foreign investment which, oddly, upsets the balance of trade in the wrong direction (the balance of trade has been negative since about 1975).

This imbalance is commonly blamed on “free trade policy”, but basic economics argues against this — especially with “free trade” the value of the dollar should self-adjust to the point where exports and imports balance.
Of note is the fact that about 31% of the federal debt is held by offshore entities, and (using slightly stale numbers, and assuming that the ratio is relatively steady over time) that amounts to about $370B of the annual deficit, as compared to the roughly $500B trade imbalance. So one can argue that deficit spending accounts for the lion’s share of the trade imbalance.
And an important point is that the top income tax bracket (the one that had tax rates reduced from 70% to 35% between 1981 and 1988) accounts for (rather roughly calculated) about $500B in tax revenue, and presumably would produce much more (let’s say another $300B) if taxed at the pre-1981 rate. (And, to the extent that this increased revenue did not materialize, it’s likely that the incredible expansion of the CEO/worker pay ratio would be reversed, as companies judged it more useful to put the money somewhere other than into more taxes.)
So my conclusion is that a “Keynesian” tax policy (accompanied by an ever-stronger tendency to under-tax the rich) is what is mostly responsible for the plateauing of real wages, and restoring pre-1981 upper bracket tax rates would likely alleviate much of the problem.
What say you?
(I’ll note that I also suspect a change in corporate governance somehow fits in here, but I haven’t researched that very much yet.)
Update 5 June 2017
My wife, knowing I’d been interested in this topic, jotted down a reference she’d heard on the radio for a book called The CEO Pay Machine, by Steven Clifford. Though I’ve not attempted to verify any of his assertions the book is published by Penguin/Blue Rider, so I assume it’s reasonably honest and accurate. (It also has some pretty good end notes and a decent index. However, Clifford’s writing style is rather plodding and not well-organized.)
Anyway, Clifford claims that, ca 1980, corporate boards were in effect sold a new bill of goods by Michael Jensen and Milton Rock. These guys put forward a philosophy of corporate management which emphasized giving CEOs “incentives” of various types, vs a simple salary and straight-forward stock options. They also promoted the idea of comparing CEOs to their peers, in terms of pay, and targeting some Nth percentile of their peer group pay.
These proposals seemed innocent enough, and many corporate boards picked them up (also accounting firms and various consultant groups, as they saw that they could profit from assisting in their implementation).
In theory “pay for performance” seemed good, but it quickly got out of hand. Obviously, when calculating CEO base pay for your company, you don’t target the 50th percentile of “peers” but go for 60, 75, even 90, because clearly you expect your CEO to be exceptional.
(Consider, for a minute, what it means if you have a bunch of companies in a “peer group” and, each time CEO pay comes up for a vote in one of the companies, they award the 70th percentile of the group. It’s a spiral, and not a downward one.)
And various stock bonus schemes strongly encouraged CEOs to play games to manipulate stock prices. Plus, as it turned out, boards were really lousy at withholding bonuses when they weren’t really earned.
Then, in 1993, Clinton and the Democratic Congress pushed through a tax increase bill that had one tiny loophole — stock options for CEOs would be exempted from corporate taxes. This resulted in an explosion of stock option awards, and overall CEO pay jumped from 100x the average worker to 300x almost overnight.
This seems to fairly completely account for the effects seen, in terms of escalating CEO pay and a portion of the lost “working class” jobs/wages. Unfortunately, the way out of this quagmire is not obvious. Clifford offers some suggestions, but getting anything through (CEO-owned) Congress will be difficult, to say the least.
Update 30 May 2018
The New Yorker published, in it’s May 14, 2018 issue, a review of the book Can Democracy Survive Global Capitalism (Norton) by Robert Kuttner. (The review is written by Caleb Crain.)
As is the case for many articles in that magazine, the review borders on impenetrable, but it does discuss factors surrounding my issue at considerable length. Based on the review, the book glorifies the economic system, both US and international, that existed after the Bretton Woods agreement (1944), and prior to 1973. According to Kuttner, 1973 marked “the end of the postwar social contract.” To quote Crain, “Politicians began snipping away restraints on investors and financiers, and the economy returned to spasming and sputtering. Between 1973 and 1992, per-capita income growth in the developed world fell to half of what it had been between 1950 and 1973.” Income inequality increased, the median real income of “working class” Americans fell. And, significantly, “faith in democracy slipped.”
Kuttner/Crain discuss a number of things that went on beginning around 1973 (including the fallout of the Arab oil embargo), but, from the philosophical standpoint they hang the economic turn-about on the return of laissez-faire philosophy to the political sphere. Eg, in January, 1974, the US removed the constraints on sending capital abroad, and in 1978 the Supreme Court overturned most state laws against usury. A litany of effects basically gutted Keynesianism as it had previously existed, and the US economy (and the world’s) lost its balance.
(I’ll note that this point of view is about 180 degrees different from the Nixon/Friedman “We are all Keynesians” view. I gather Kuttner regards the Nixon/Friedman postures as false.)
~ * ~ * ~ * ~

(I have noticed that many charts, such as yours above, begin at around 1975, thereby omitting the anomaly. )
This is taken from Bivens and Mishel (2015). In essence, they decompose labour productivity into its different components (see technical appendix, page 25). These components are three:
- Labour share: how much of total product (they use Net Domestic Product, NDP) is paid to workers
- Terms of trade: discrepancies between NDP deflator and CPI. Recall real wages are deflated with CPI, whereas GDP price index include other stuff like price of investment, terms of trade, etc.
- Inequality of pay: a rough measure of the difference between mean and median pay. If wages are equally distributed, these two are equivalent.
If you are interested on mean wages, then the third component does not apply. The other two do. Thus, a lot of the problem is due to prices issues. As the authors note:
That is, workers have suffered worsening terms of trade, in which the prices of things they buy (i.e., consumer goods and services) have risen faster than the prices of items they produce (consumer goods but also capital goods). Thus, if workers consumed investment goods such as machine tools as well as groceries, their real wage growth would have been better and more in line with productivity growth. We sometimes refer to this terms-of-trade wedge as the difference between “consumer” and “producer” price trends. (p.6)
~ * ~ * ~ * ~
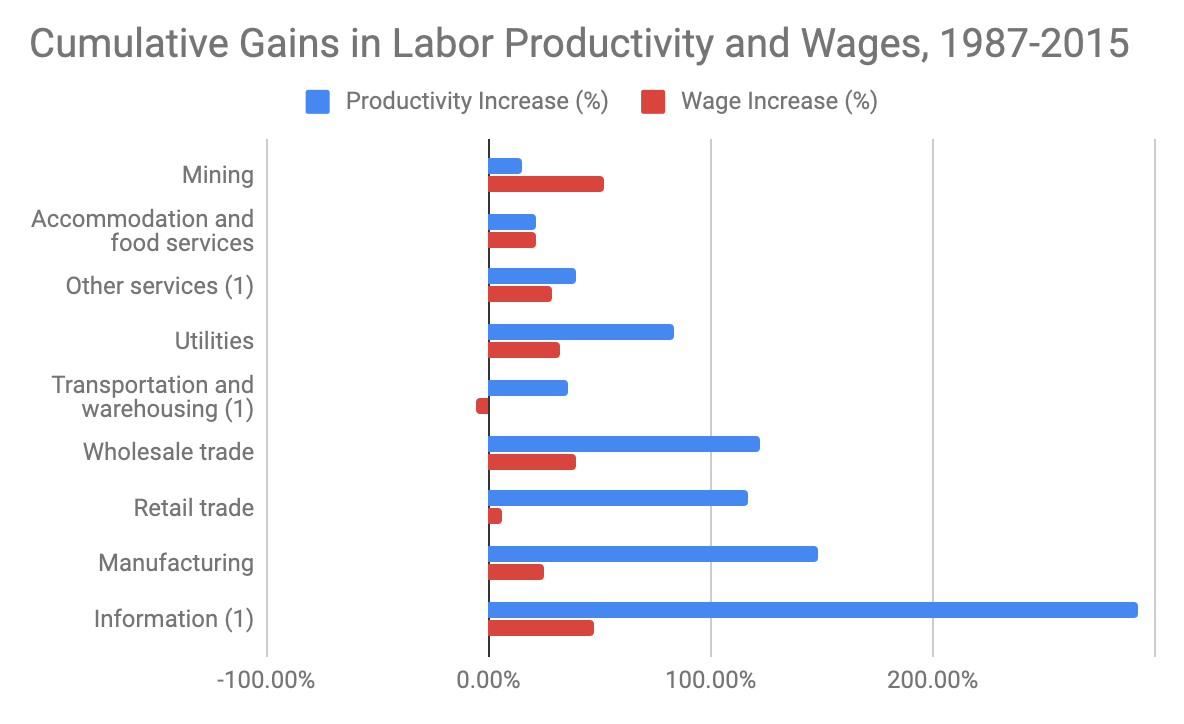
The cause of the wage and productivity growth gap varies a lot by each sector so it’s useful to look at that data. If we look at a breakdown of the last 30 years, we can probably try to understand things in a more nuanced fashion: